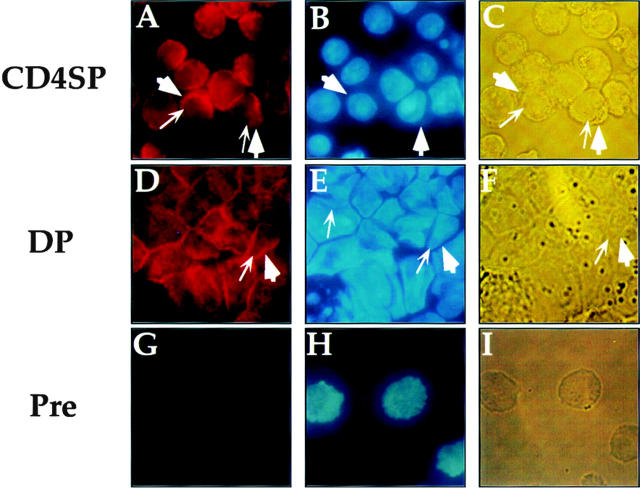
Figure 7.
Subcellular localization of SAF in CD4+ SP and CD4+CD8+ T cells. Staining with the affinity-purified anti-SAF antisera (A and D), DAPI (B and E) and the light-phase field (C and F) of the D10 CD4 SP and the AKR1G1 CD4+CD8+ T cells are indicated. Each set of fields is from the same experiment. G–I show staining with the preimmune serum, DAPI, and light-phase field for a CD8 SP T cell; all other preimmune stainings for the other cell types showed similar patterns (data not shown). Thick arrows indicate cell membrane, and thin arrows indicate nuclear membrane.

