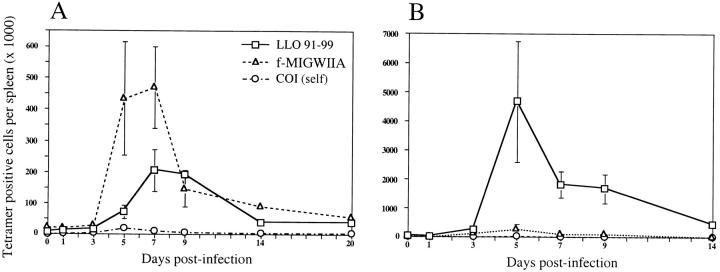
Figure 6.
H2-M3–restricted T cell responses differ from H2-Kd–restricted T cells during both primary infection and reinfection with L. monocytogenes. The total number of CD8+ CD62Llow (activated), tetramer-positive cells (for H2-M3/f-MIGWIIA, H2-M3/COI self, and H2-Kd/LLO91–99 tetramers) was quantified from mice at each time point during primary and recall studies. Absolute numbers (y-axis) are shown for primary infection (A) and recall infection (B) with days after infection marked on the x-axis. Averages and SD are shown for three mice per day except primary days 0 (uninfected), 20, and 48 (recall day 0), at which times there were two mice. Note that y-axes have different scales for primary and recall infections.

