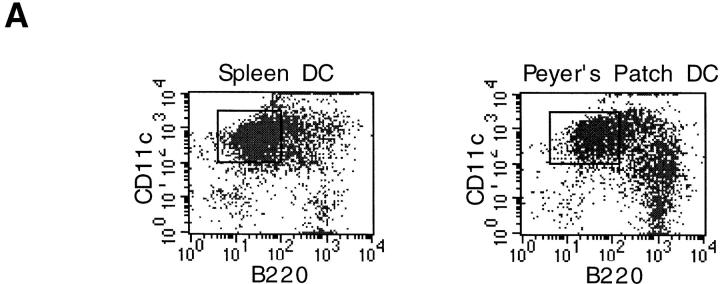
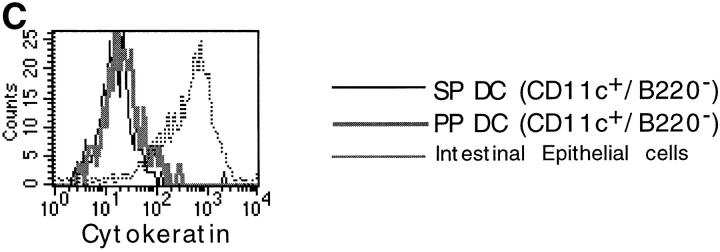
Figure 1.
Phenotypic analysis of sorted DC populations from SP and PP. (A) Cells from PP or SP were isolated using magnetic beads as described in Materials and Methods, and were dual stained with the FITC-conjugated anti-B220 and PE-conjugated anti-CD11c antibodies. Cells that subsequently were sorted by FACS® and used for T cell stimulation are indicated by the enclosed square (CD11c+/B220−). (B) RT-PCR analysis of B and T cell contamination in sorted DC populations. Magnetically selected DCs from SP and PP were further purified by flow cytometric sorting into either CD11c+/B220− or CD11c+/B220+ cells. Total RNA was extracted from sorted DCs and analyzed by RT-PCR for expression of B (CD19) and T (CD3) cell markers. RT-PCR of β2m was included as a positive control for mRNA in each sample. An RT-PCR profile of total PP tissue was included to indicate that B and T cells were present in the starting population (right). (C) Exclusion of epithelial cells from sorted DC populations. CD11c+/B220− cells from SP and PP were stained for the pan-epithelial cell marker, cytokeratin. In parallel, freshly isolated intestinal epithelial cells were stained with the same antibody (dotted line) as a positive control.


