
Figure 2.
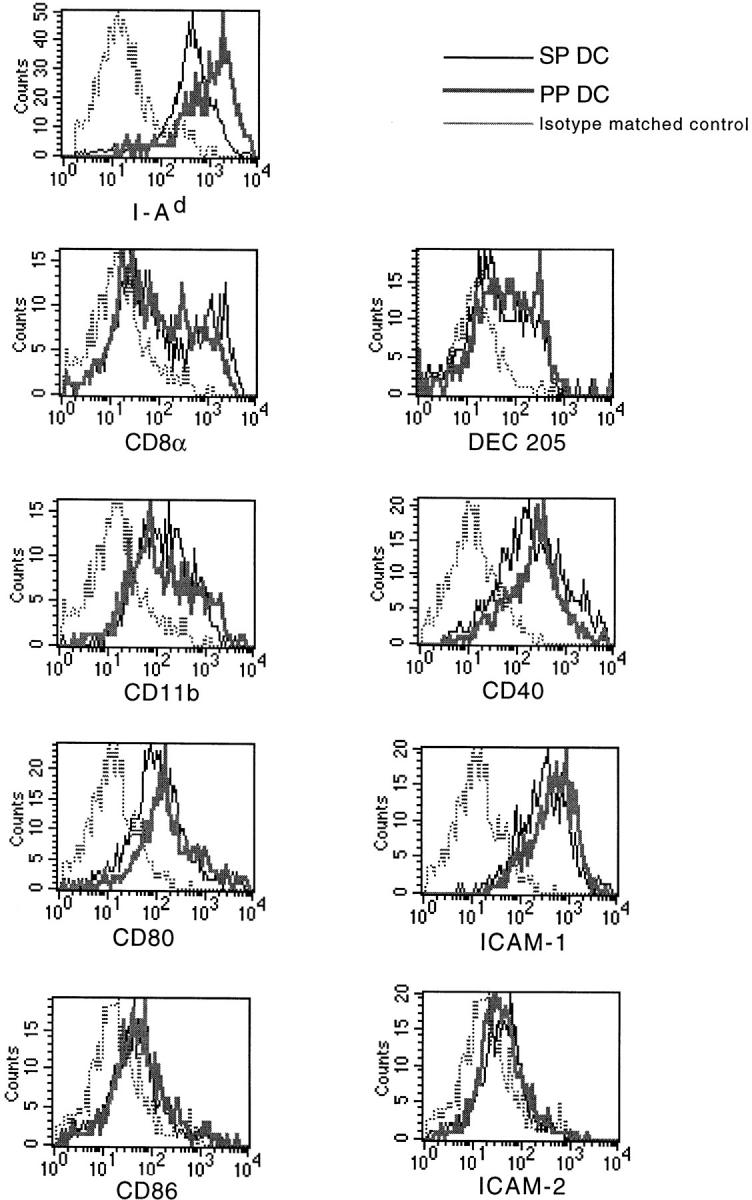
Surface phenotype analysis of sorted DC populations from SP and PP. Sorted CD11c+/B220− DCs from SP or PP were analyzed for expression of various surface molecules. The results are shown as histograms with fluorescence intensity on the x-axis and cell number on the y-axis. The thin lines represent staining of SP DCs, and the thick lines staining of PP DCs. Isotype-matched control is indicated for each antibody set with a dotted line. The data depicted here represents four independent experiments producing similar results.