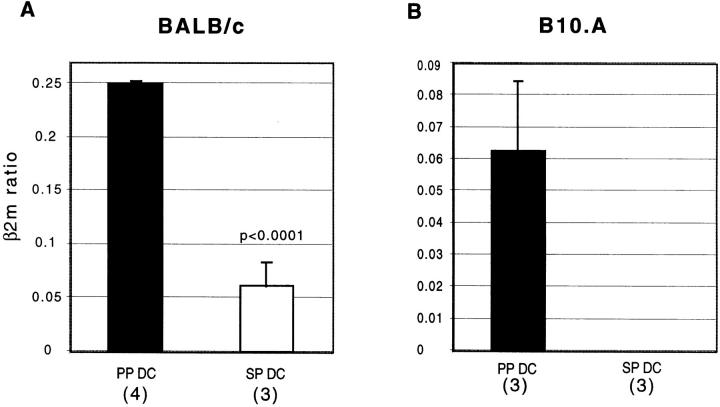
Figure 7.
Expression of TGF-β by freshly isolated PP DCs. cDNA samples prepared from freshly isolated PP and SP DCs from BALB/c (A) or B10.A (B) mice were analyzed by competitive RT-PCR for the expression of TGF-β and a control marker, β2m, as described in Materials and Methods. The ratios of TGF-β mRNA level to β2m mRNA level derived from the same cDNA sample are depicted on the y-axis as the mean values of at least three separate experiments ± SEM. The number of separate experiments done for each DC population are indicated in parentheses.

