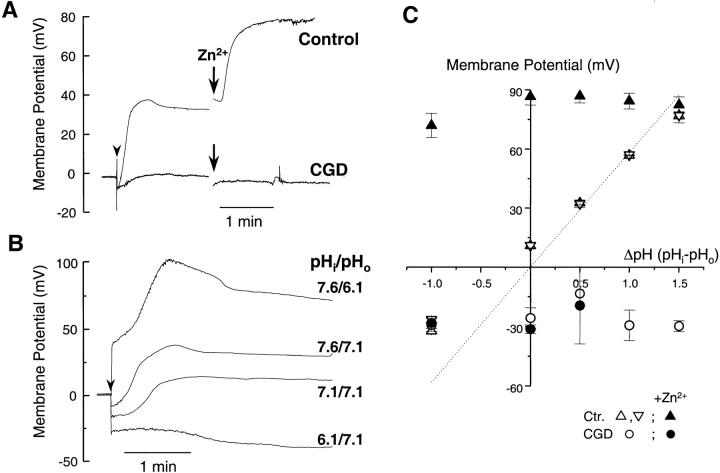
Figure 1.
Membrane potential changes during activation of control and CGD eosinophils. The membrane potential of eosinophils, determined as the zero current holding potential, was measured in current clamp mode after the formation of the whole cell configuration (arrowhead). The pipette solutions contained 8 mM NADPH and 25 μM GTPγS to activate the oxidase. (A) Time course of the membrane potential changes in control and CGD eosinophils, measured in Cs+-based solutions containing 10 mM TEA (pHi = 7.6, pHo = 7.1). When indicated, the H+ conductance blocker, Zn2+ (10 μM), was added to the bath solution. (B) Membrane potential changes measured with CsCl solutions buffered to different pH. (C) The steady state membrane potential of control (triangles) and CGD cells (circles) is plotted against the transmembrane pH gradient, measured in CsCl (upward triangles) or quasiphysiological (downward triangles) solutions, in the absence (open symbols) or presence (filled symbols) of Zn2+. The dotted line represents the calculated H+ equilibrium potential. Data are mean ± SEM of ≥5 experiments for each condition.

