Figure 2.
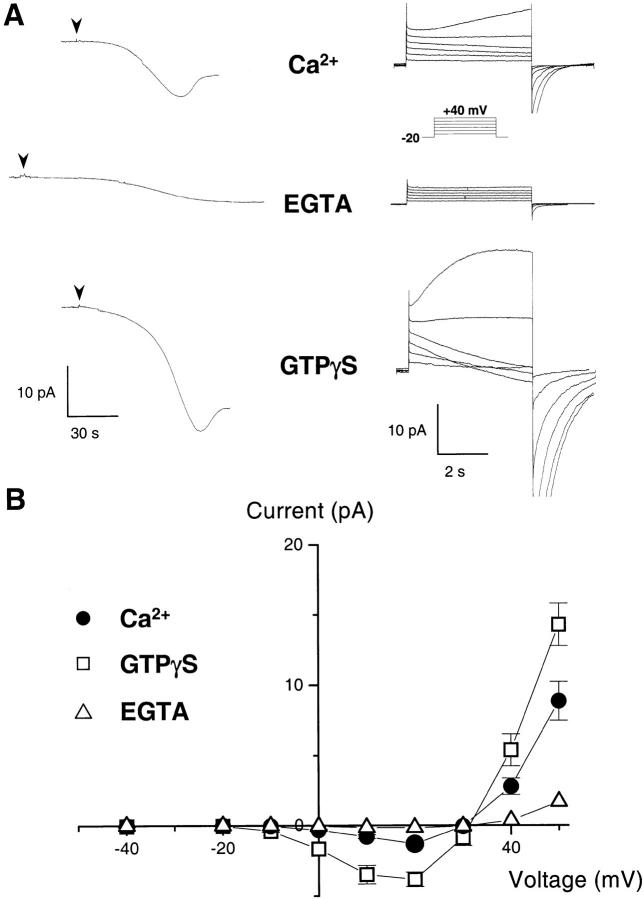
H+ currents during activation of the NADPH oxidase. (A) Whole cell current in human eosinophils measured under resting and stimulated conditions. The pipette solution contained 8 mM NADPH to provide substrate for the oxidase, and either no calcium buffer (top, ∼5 μM free [Ca2+]), 10 mM EGTA (middle), or 25 μM GTPγS (bottom). After break-in (arrowheads), the electron currents were recorded at 0 mV (left traces). After achieving a steady state, the holding voltage was changed to –20 mV, and 5-s depolarizing steps ranging from –10 to +40 mV (inset) were applied in 10-mV increments to elicit H+ currents (right traces). Traces are representative of ≥20 experiments for each condition. (B) Current–voltage plot of the voltage-dependent currents measured with ∼5 μM free [Ca2+] (•), 25 μM GTPγS (□), and 10 mM EGTA (▵). Currents measured 500 ms after the beginning of a 5-s-long voltage pulse were subtracted from the current measured at the end of the pulse. The leak-subtracted currents reversed sign around +30 mV, close to the H+ reversal potential (pHi = 7.6, pHo = 7.1; EH+ = +29 mV; mean ± SEM of ≥7 experiments).

