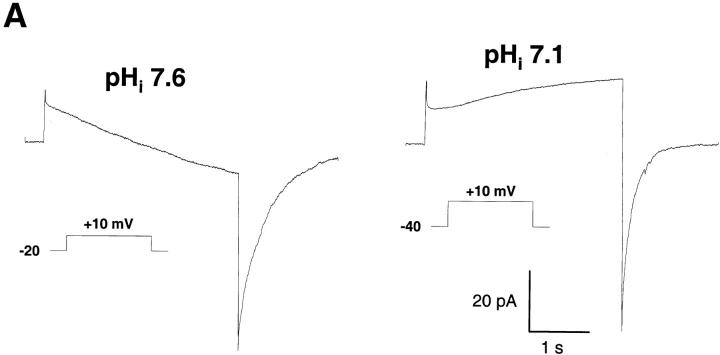
Figure 4.
pH dependence of the H+ currents. (A) Currents elicited by a 5-s depolarizing pulse to +10 mV in cells perfused with alkaline (pH = 7.6, n = 20) or neutral (pH = 7.1, n = 7) pipette solutions containing 25 μM GTPγS. (B) Current–voltage relationship measured at a pipette pH of 6.1 (▾), 7.1 (▵), 7.6 (•), and 8.1 (□). The holding voltage was –60 mV (pH 6.1), −40 mV (pH 7.1), and –20 mV (pH 7.6 and 8.1), and bath pH was 7.1 in all conditions. Arrows indicate the H+ equilibrium potential for each condition. Data are mean ± SEM of ≥7 experiments for each condition.


