Figure 8.
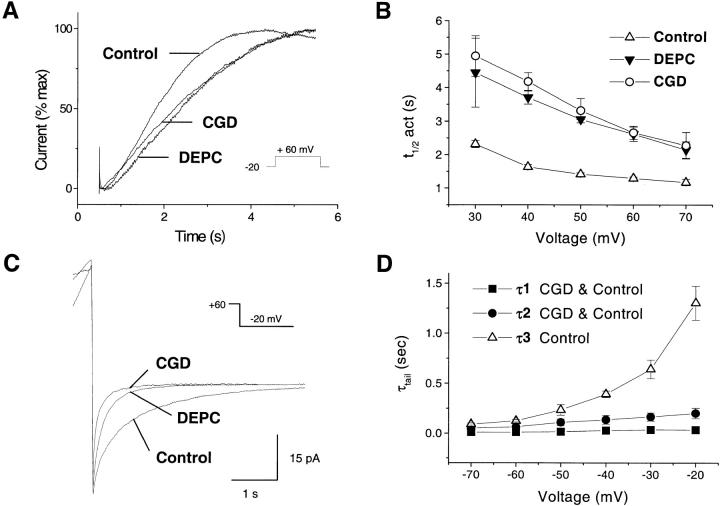
Activation and deactivation of the currents in control and CGD cells. pHi 7.1 (A, B) or 7.6 (C, D), pHo 7.1. (A) Kinetics of current activation in control, CGD, and DEPC-treated cells. Currents elicited by a 5-s-long pulse from –20 mV to +60 mV were normalized to the maximal current recorded at this voltage and superimposed for comparison. (B) Voltage dependence of current activation. The time for half-maximal activation (t 1/2 act) is plotted against the activating voltage. (C) Kinetics of current deactivation during repolarization from +60 mV to –20 mV. Cells were depolarized for various durations to induce currents of similar amplitude. Traces are representative of ≥9 experiments. (D) Voltage dependence of the deactivation time constants (τtail), estimated by fitting exponential curves to the currents measured after a pulse to +60 mV. The two fast kinetic components (τ1, ▪; τ2, •) are present in both control and CGD cells, whereas an additional third slow component (τ3, ▵) is absent from CGD cells. Data are mean ± SEM of ≥5 experiments for each condition.

