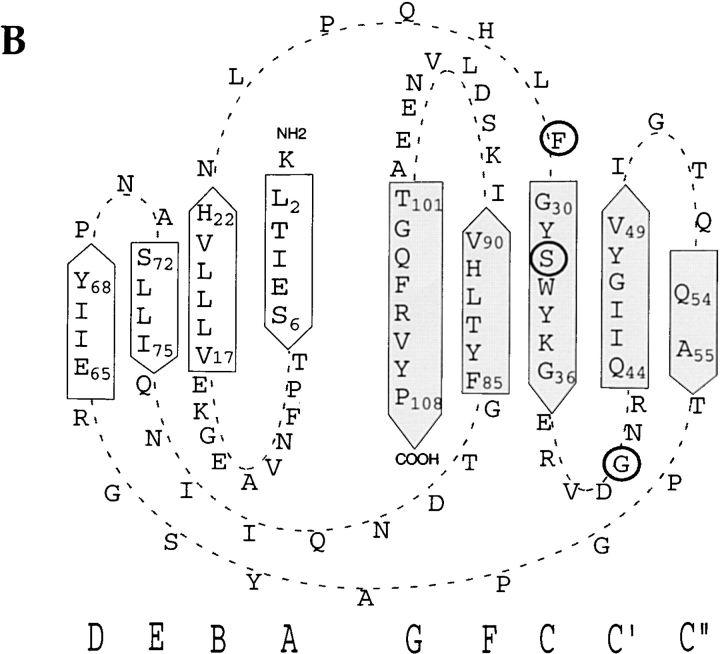
Figure 1.
Protein sequence comparisons of CD66 N-domains. (A) Amino acid alignment of CD66 N-domains, deduced from DNA sequencing of N-domain clones as used in this and our previous study (reference 18). Dots indicate residues identical to CD66e. (B) Diagrammatic figure of the fold of the CD66e domain as predicted by Bates et al. (reference 32) and the PredictProtein computer program (reference 33). Strand designation is indicated by capitals below the diagram. Residues determining Opa protein binding as identified in this study are indicated by circles.


