
Figure 1.
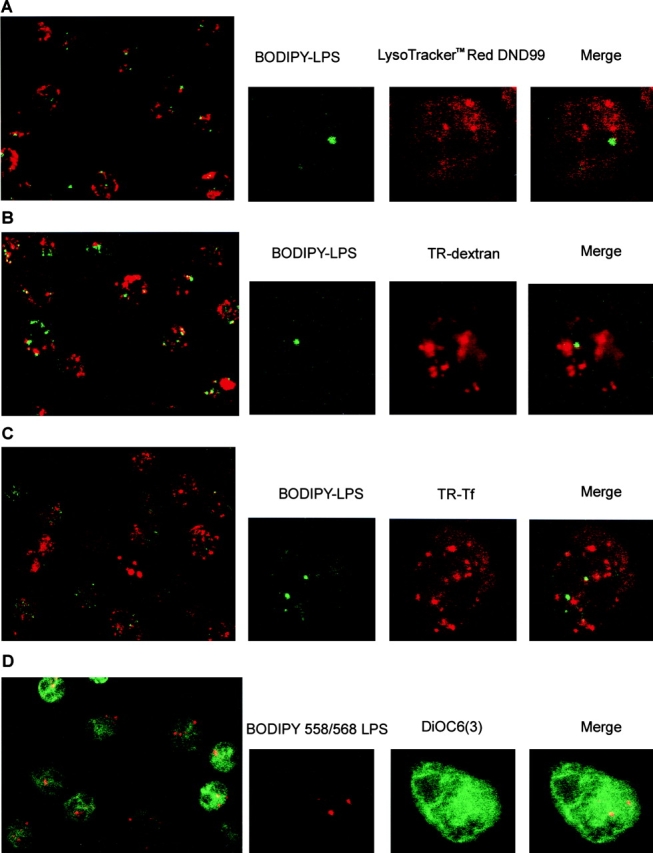
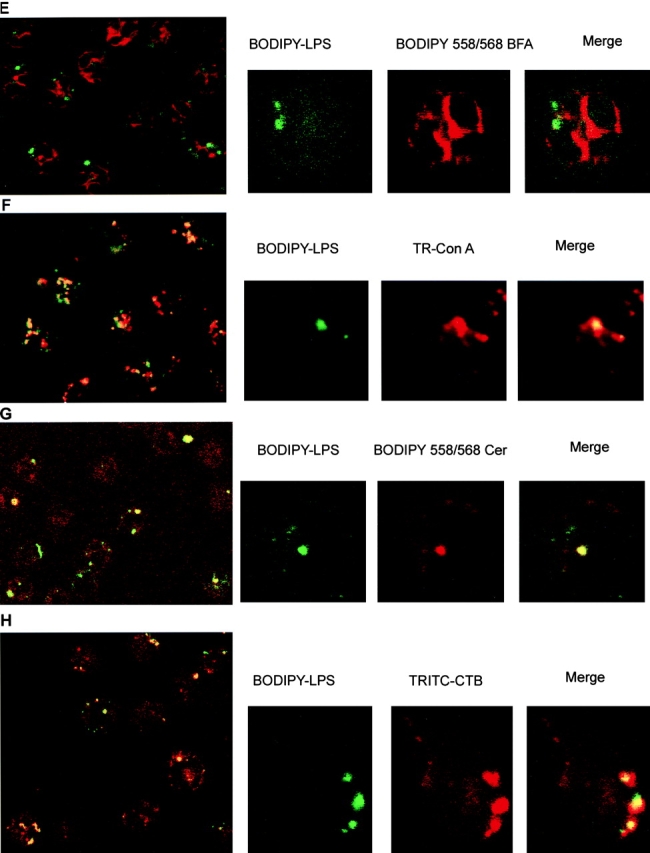
Intracellular distribution of LPS and organelle markers in neutrophils. Different markers of organelles were incubated with BODIPY–LPS–sCD14 for 30 min at 37°C and processed for microscopy. LPS, visualized in green (A–C, E–H) or in red (D), is concentrated in vesicles or tubules. Optical sections of single fluorescently labeled neutrophils are shown in the smaller panels: left, fluorescence for LPS alone; center, the organelle marker alone; and right, a merged image of both. A merged image of a lower power field is shown in the large panels. (A) Labeling in red of lysosomes with LysoTracker™ Red DND-99 (50 nM) shows lysosomes to be distributed throughout the cytoplasm in a punctate pattern. Merging magnified areas of optical sections of fluorescently double-labeled neutrophils shows that LPS vesicles do not overlap with the labeling pattern of lysosomes. (B) Labeling with TR–dextran (1 mg/ml) reveals endosomes. Although LPS vesicles appear in different sites than endosomes, some can be found associated with endosomes. (C) Labeling in red with TR–Tf (2 μg/ml) shows endosomes of the recycling pathway. Merging magnified areas of optical sections of fluorescently double-labeled neutrophils shows that LPS vesicles do not overlap with the labeling pattern of Tf. (D) When BODIPY–LPS labeling is compared with the ER labeling in green performed with DiOC6(3), LPS fluorescence was distinct from the ER pattern. (E) Similar results were observed with TR–BFA, a second ER stain. (F) Con A stains ER and the cis-Golgi apparatus. Double-labeled neutrophils with BODIPY–LPS–sCD14 and TR–Con A (2 μg/ml) show that LPS vesicles partially overlap with structures labeled with Con A. When the patterns of BODIPY–ceramide–BSA (0.5 μM) labeling (G) or TRITC–CTB (0.1 μg/ml) labeling (H) are compared with the pattern of BODIPY–LPS–sCD14 labeling, the brightly labeled LPS vesicles colocalize with the Golgi complex markers.