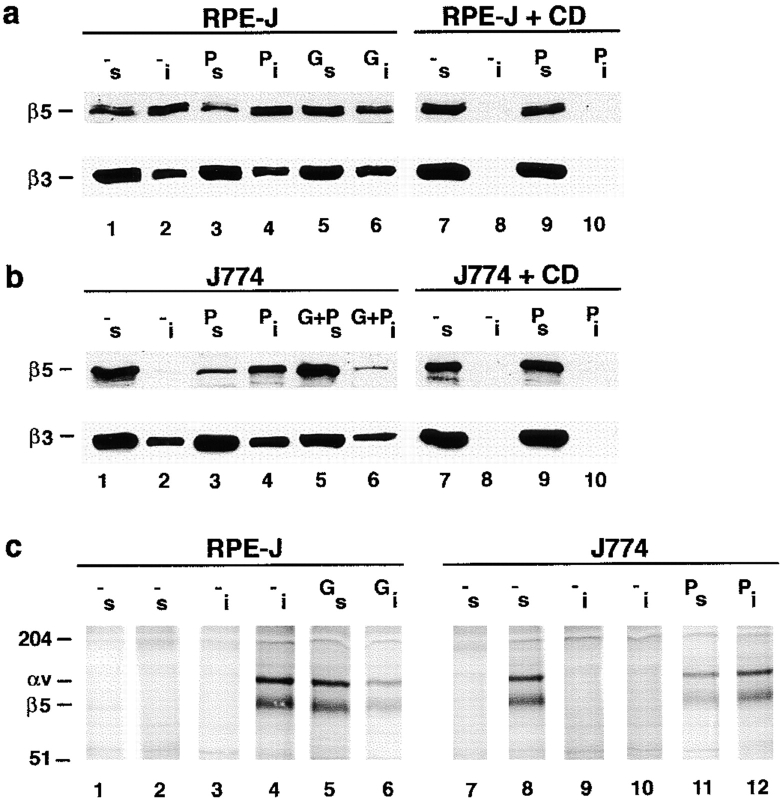
Figure 9.
PKC activation or inhibition affects the cytoskeletal stabilization of αvβ5 integrin receptors in RPE and in macrophages. (a and b) β5 but not β3 resistance to nonionic detergent extraction correlated with PKC activation in RPE and macrophages. Pretreatment conditions were as in Fig. 8. G+P represents treatment with Gö6976 for 15 min, followed by the addition of PMA to this inhibitor medium for 30 min. After pretreatment, cells were separated in detergent-soluble and insoluble fractions as described in Materials and Methods. Protein concentrations in the fractions revealed that 35% total cellular protein was present in the soluble fraction, and 65% in the insoluble fraction. This distribution was the same comparing RPE and macrophages and did not change after treatment with PKC activators or inhibitors. Integrin distribution in subcellular fractions were compared by Western blotting with β5 polyclonal antibody (upper lanes) or β3 antibody 26 (lower lanes) after nonreducing SDS-PAGE. Lanes with odd numbers are soluble fractions (labeled s), and lanes with even numbers are the corresponding insoluble fractions (labeled i), of cell types and treatment as indicated (see legend to Fig. 8). Actin microfilament disruption with 10 μM Cyt D completely solubilized β3 and β5 (a and b, lanes 7 and 8) and prevented PMA-induced recruitment of β5 into insoluble fractions (a and b, lanes 9 and 10). Shown here is one representative experiment out of a total of five experiments. Corresponding soluble and insoluble fractions were separated in duplicate on the same gels and blotted for β5 or β3. The appearance of unidentified secondary bands in some β5 blots was variable and did not correlate with pharmacological treatment. (c) PKC activation or inhibition regulated extractability of αvβ5 heterodimeric receptors. Metabolically labeled cells were pretreated and separated into soluble (lanes 1, 2, 5, 7, 8, and 11, labeled s) and insoluble fractions (lanes 3, 4, 6, 9, 10, and 12, labeled i). From each fraction, immunoprecipitates with nonimmune mouse IgG (lanes 1, 3, 7, and 9) or P1F6 antibody (all other lanes) were analyzed by nonreducing SDS-PAGE and fluorography. Note that J774 immunoprecipitates with P1F6 after separation of cells into soluble and insoluble fractions exhibited lower backgrounds than immunoprecipitates from total cell lysates (see Fig. 8 a, lanes 5 and 6), possibly due to the dilution of proteins that bound nonspecifically to P1F6 immune complexes. Quantification values given in the text represent means of four experiments, of which one representative experiment is shown.

