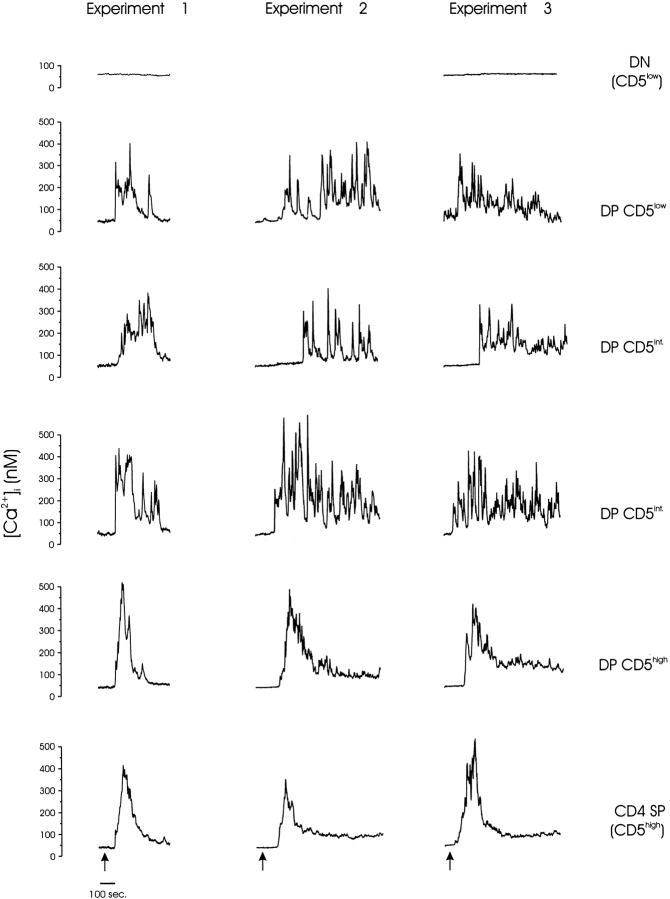
Figure 3.
TCR/CD4-mediated calcium responses of phenotypically defined thymocytes. Single-cell video imaging was used to measure Ca2+ i within all thymocytes in a 100× objective field. Biotin-conjugated, mAb-labeled surface CD3 and CD4 were aggregated by addition of streptavidin (0.5 μg/ml) to the bath chamber (arrows). The [Ca2+]i is plotted for individual thymocytes (identified in the bright field image by number) to demonstrate differences in the calcium signaling pattern associated with each maturation phenotype. The composite CD4/CD8/CD5 phenotype of each cell was determined by manually analyzing separate fluorescent images obtained for each receptor in situ, and the aggregate thymocyte phenotype is indicated. The cells shown are representative of all cells of similar phenotype in this experiment, and these data are from three similar experiments. Experiments 1 and 2 were performed at 25°C, and experiment 3 was performed at 37°C.

