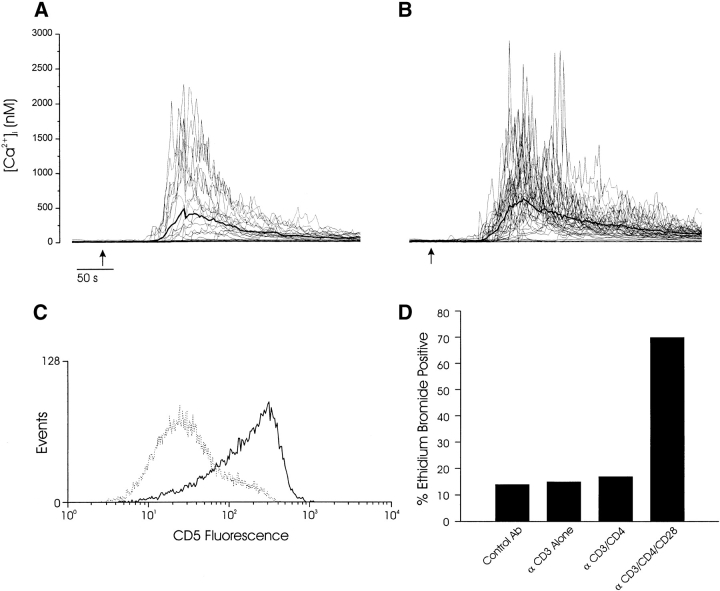
Figure 7.
Correlation between calcium signaling response and thymocyte fate. Calcium signaling responses of single thymocytes after aggregation of (A) CD3 and CD4 or (B) CD3, CD4, and CD28 with streptavidin-coated microspheres (see Materials and Methods). The mean calcium response is indicated in each plot with a bold line. The thymocyte/microsphere ratio was ∼1:1, and all responding cells contacted a single microsphere. In these experiments, 1/18 cells (A) exhibited a single spike subsequent to the initial transient [Ca2+]i elevation, whereas 18/32 responding cells (B) exhibited one or more calcium spikes ≥50% of the initial peak [Ca2+]i. Arrows indicate the times when microspheres were added to the recording chamber. (C) CD3/CD4-coated microspheres induced increased CD5 expression (solid line) compared with control antibody–treated cells (broken line) but not apoptosis (D, third bar from left). (D) CD3-, CD4-, and CD28-coated microspheres induced a significant increase in the number of apoptotic cells. These maturation and calcium results are representative of at least three separate experiments with microspheres.

