
Figure 3.
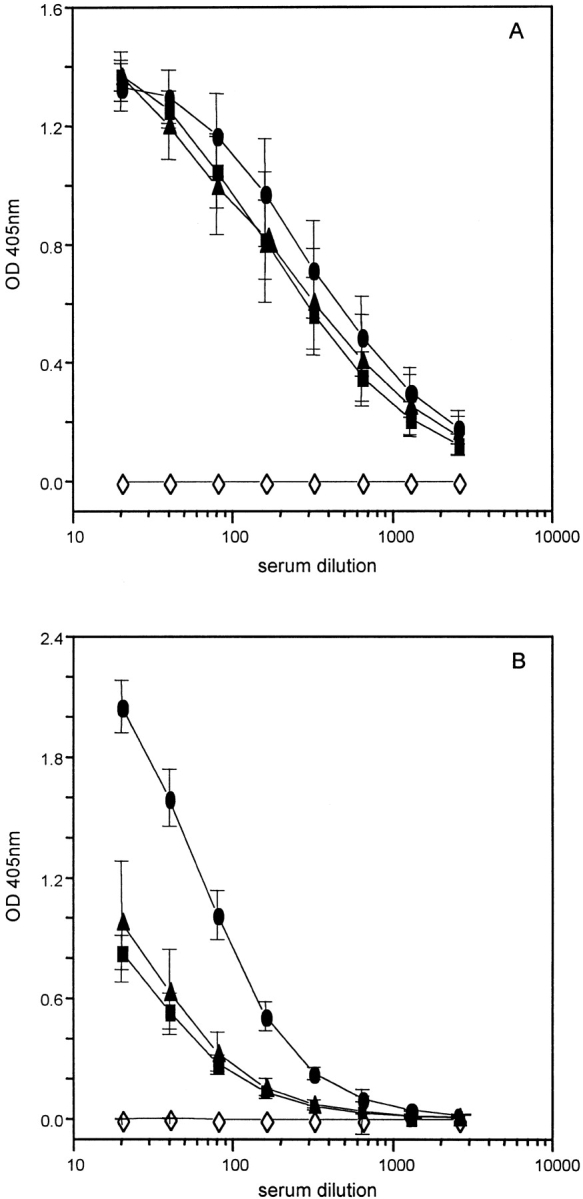
Ag-specific IgG isotype responses from naive (⋄) and T. muris–infected C57BL/6 mice after treatment with PBS (▴), anti–TNF-α (•), or control Ig (▪). Serum was collected from naive and infected mice at day 35 p.i. and assayed by capture ELISA for the presence of IgG1 (A) and IgG2a (B). Results represent the mean of four mice per group ± SEM.