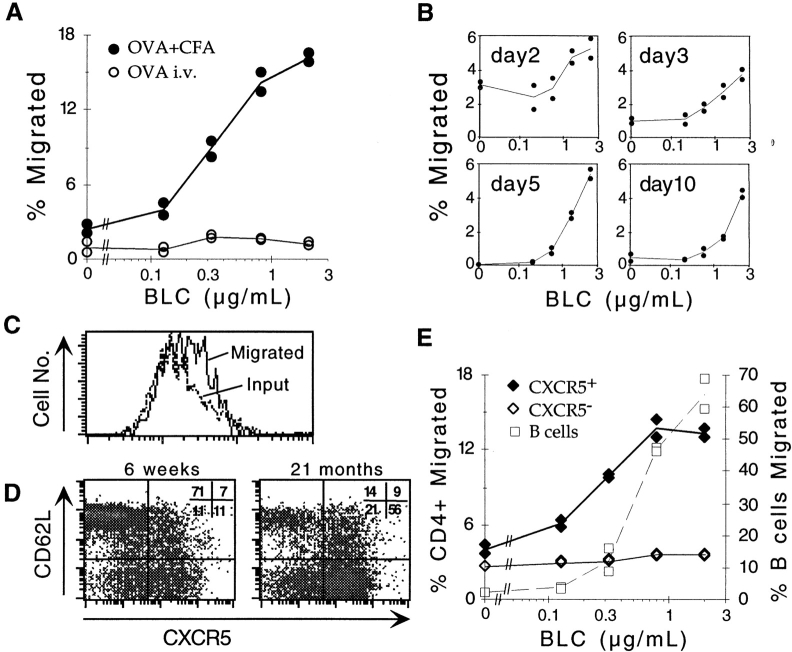
Figure 4.
BLC chemotactic response of in vivo–activated OVA-specific T cells and memory phenotype CXCR5-expressing T cells. Results are expressed as percentage of transmigrated input cells. Lines represent means of duplicate transwells. (A) Chemotactic response of KJ1-26+CD4+ cells from draining LNs of Balb/c recipients of OVA-specific CD4 T cells immunized 7 d before analysis with OVA peptide subcutaneously in CFA (•) or intravenously in saline (○). Results were similar at day 5 after immunization and are representative of five independent experiments. (B) Kinetic analysis of OVA-specific T cell acquisition of BLC responsiveness. The day after immunization with OVA peptide subcutaneously in CFA is indicated in each panel. Differences in basal migration levels were not reproducible and reflect assay to assay variability. Results are representative of at least two independent experiments at each time point. (C) CXCR5 expression on KJ1-26+CD4+ cells from day 3 draining LNs showing the total input population (Input) and the cells that migrated to BLC (Migrated). (D) CXCR5 and L-selectin (CD62L) expression on CD4+ splenocytes from young (left panel) and 21-mo-old (right panel) B6 mice. Numbers represent the percentage of CD4+ and lymphocyte size-gated cells in each quadrant. Similar results, with progressive accumulation of L-selectinlo and CXCR5hi T cells, were obtained for more than 10 animals <3 or >12 mo of age. (E) Chemotactic response of CXCR5hi (♦) and CXCR5lo/− (⋄) CD4+ T cells, and of B cells (□) from the spleen of a 21-mo-old mouse. The y-axis on the left refers to T cells, and on the right to B cells. Results are representative of eight independent experiments.

