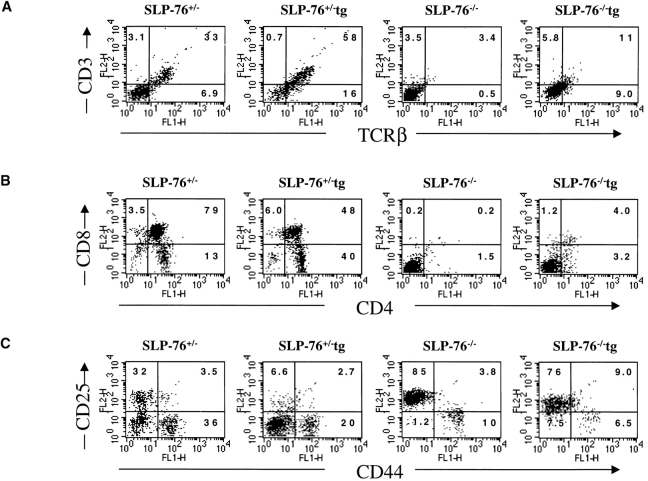
Figure 4.
Flow cytometric analysis of thymocytes from TCR-transgenic SLP-76−/− and SLP-76+/− littermates. Surface expression on thymocytes of (A) CD3 (anti-CD3∈–PE) versus TCR-β (anti–TCR-β–FITC), (B) CD4 (anti-CD4–FITC) versus CD8 (anti-CD8–PE), and (C) CD44 and CD25 on DN thymocytes from SLP-76−/− and SLP-76+/− littermates. Cells were triple stained with anti-CD44–FITC, anti-CD25–PE, and a cocktail of biotin-conjugated mAbs to CD3, CD4, CD8, B220, Mac-1, and Gr-1, followed by streptavidin–Cy-Chrome. Analysis was performed on gated Cy-Chrome–negative cells. The percentage of cells found in each quadrant is indicated. In all FACS™ analyses, results from SLP-76+/− and WT mice were similar. Therefore, only data of SLP-76+/− mice is shown. Results are representative of four mice examined in each group.

