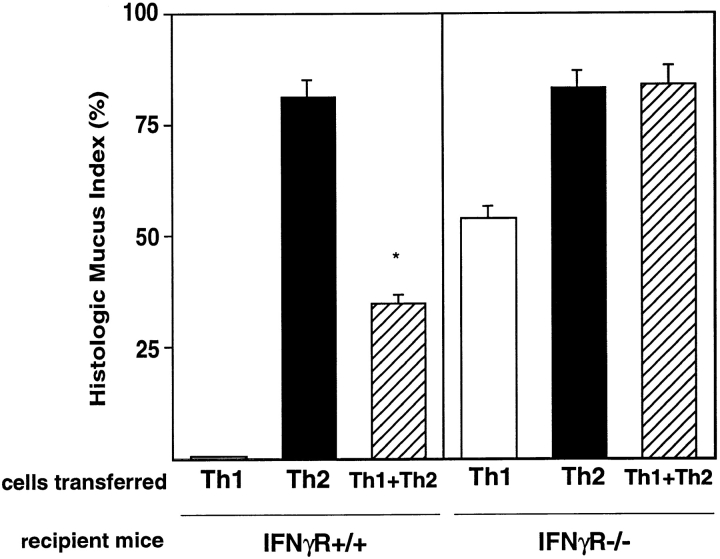
Figure 6.
Airway mucus production in IFN-γR−/− mice. Th1, Th2, or Th1 + Th2 cells (2.5 × 10⁶ cells from each population) were transferred into IFN-γR+/+ (BALB/c) or IFN-γR−/− recipient mice, and mice were exposed to inhaled OVA. Mucus staining was assessed on PAS-stained lung sections. Data represents mean HMI (±SEM) (n = 4 mice per group). One experiment is shown and is representative of two experiments. Statistical significance was determined by unpaired Student's t test. *P < 0.0004 Th2 versus Th1 + Th2.

