Figure 1.
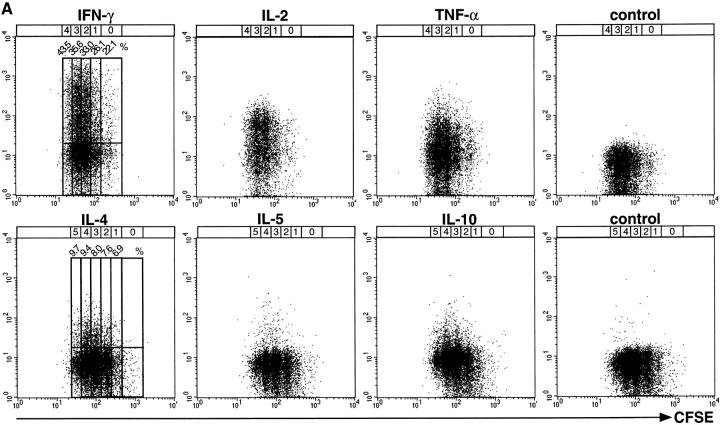
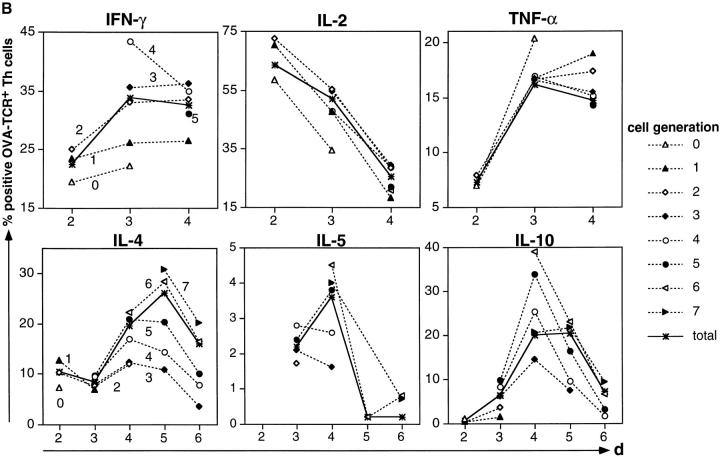
Correlation of cytokine expression with proliferation of activated Th lymphocytes. CFSE-labeled, naive CD62L+CD4+ OVA-TCRtg/tg cells were stimulated with OVA323–339 and APCs either in the presence of IL-12 and anti–IL-4 for the analysis of IFN-γ, IL-2, and TNF-α expression, or with IL-4, anti–IL-12, and anti–IFN-γ for the analysis of IL-4, IL-5, and IL-10 expression. Cells were restimulated with PMA/ionomycin after 2–6 d. After fixation and permeabilization, the cells were intracellularly stained for cytokines. (A) Flow-cytometric analysis of cytokine expression in OVA-TCR+ Th cells of different generations, restimulated at day 3 after primary activation. For analysis, gates were set on OVA-TCR+ Th cells, identified by the clonotype-specific mAb KJ1-26. To determine the frequencies of cytokine-expressing OVA-TCR+ Th cells, regions were set according to the control stainings, using the secondary detection antibody or PE-conjugated isotype control mAb. The percentages of IFN-γ– and IL-4–expressing Th cells are plotted for the individual cell generations. The number and position of individual cell generations are indicated above the dot plots according to CFSE intensity of nondivided and nonstimulated OVA-TCR− Th cells. (B) Percentages of cytokine-positive OVA-TCR+ Th cells at different time points after priming within the total cell populations (solid line), and in cells of different generations (dashed lines). Indicated frequencies include subtraction of the respective control staining values (background frequencies).


