Figure 3.

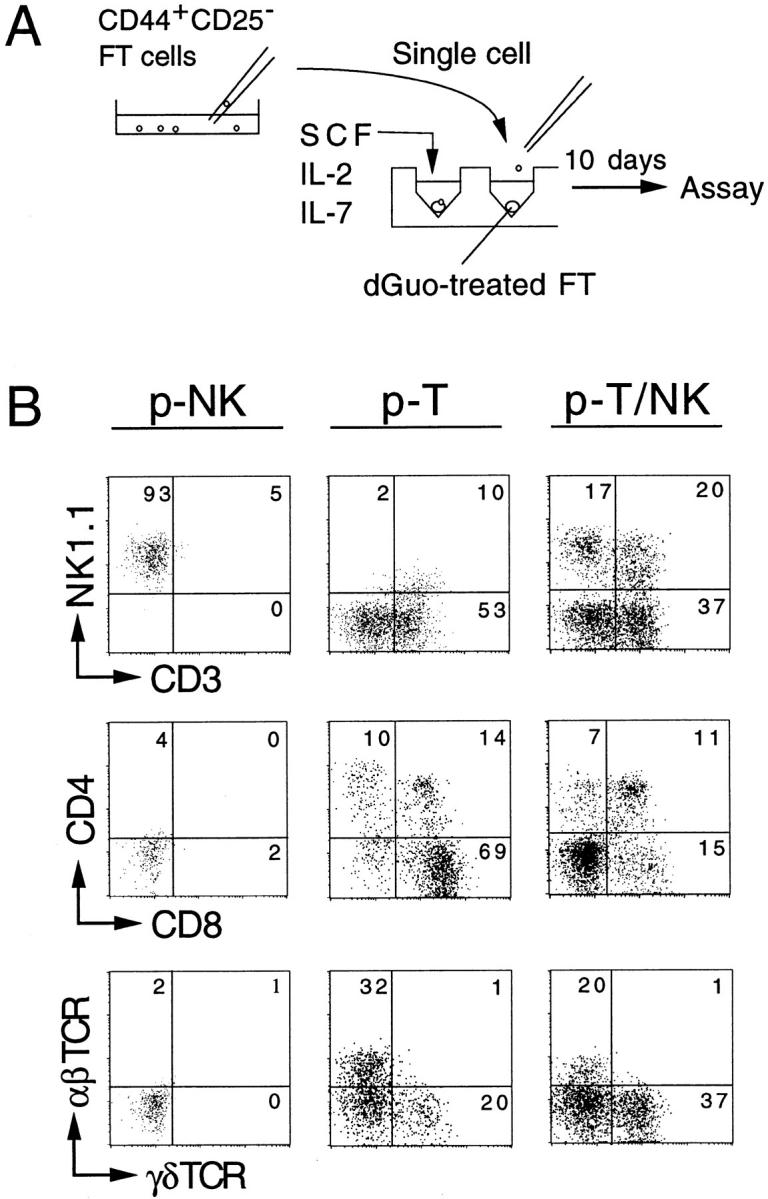
Representative flow cytometric profiles of cells derived from single FT progenitors. (A) Procedure of the clonal assay culture is shown. Single CD44+CD25− FT cells (14 dpc) were picked up under microscopical visualization, then seeded into the wells where a dGuo-treated FT lobe had been placed. The culture medium used was supplemented with a cytokine cocktail (see legend to Fig. 1). Cells were cultured under HOS conditions for 10 d. (B) Examples of the flow cytometric profiles of cells generated from p-NK, p-T, and p-T/NK are shown. Cell recoveries in these clones were 2.4 × 10⁴, 8.0 × 10⁴, and 2.0 × 10⁵, respectively.
