
Figure 2.
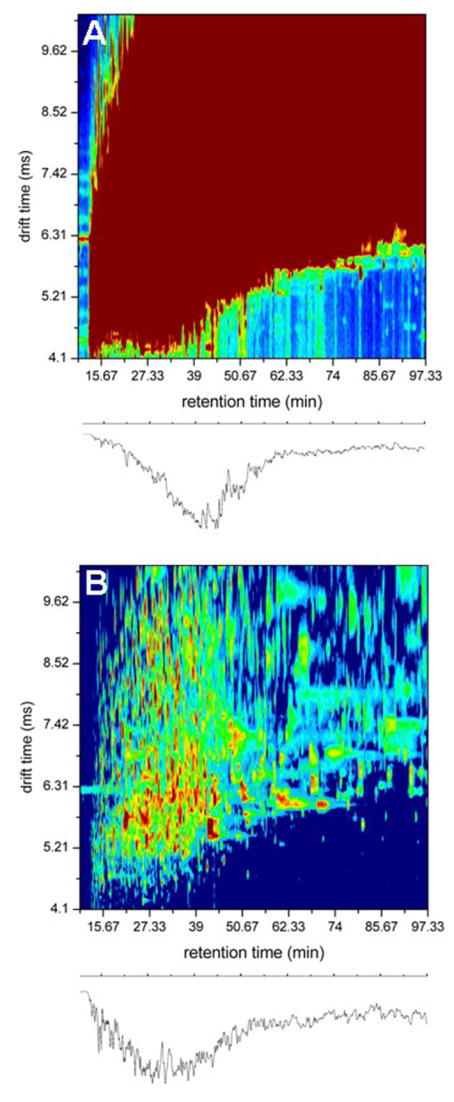
Part A shows a two-dimensional, tR(tD) plot of the raw data (A) for a single SCX fraction (sample 3). The plot is obtained by summing all TOF bins at each tR and tD value. Intensities are represented as a color map with the most intense level set at 150 counts. The representation indicates that individual two-dimensional bins are saturated across a wide range of retention and drift times. Part B shows the same data when plotted as a two-dimensional, tR(tD) base-peak diagram. This plot is obtained by extracting the intensity value obtained for the most intense m/z value in the MS measurement (extracted for every tR (tD) position to create the contour plot). The traces below each contour plot show the ion chromatograms obtained by integrating all tD bins at each tR for the respective 2D plots. For more details about the generation of these datasets see text references and discussion therein.