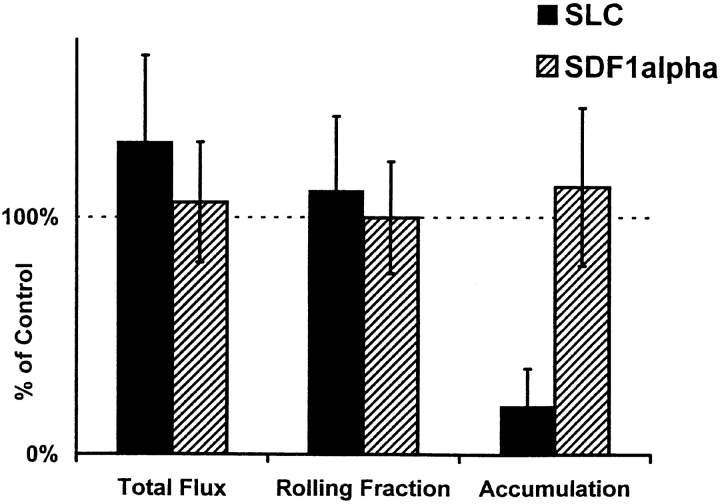
Figure 1.
Desensitization of LNCs with SLC inhibits arrest in PP-HEVs. Unfractionated LNCs (70–85% CD3+ by FACS®) of young mice were washed and incubated in cRPMI for 1 h in tissue culture flasks. LNCs were fluorescently labeled, incubated with chemokine (SLC and SDF-1α) or control medium for 45 min at 37°C, washed through a warm serum gradient to remove residual chemokine, and resuspended together with internal standard cells (labeled in a different color) immediately before injection via carotid artery cannulation into mice prepared for intravital microscopy. Areas within the visualized PPs were surveyed in the initial 2 min for HEVs supporting lymphocyte interactions, and then observed for a further 10 min. Total flux and rolling data (for test and for internal standard cells) were collected during a 2-min period 6–8 min after injection, and represent at least 10 consecutive cells of each type in at least 10 HEVs per preparation. Accumulated cells in these same HEVs were enumerated at the 8-min time point. Lymphocyte total flux, rolling fraction, or accumulation was variable in different vessels and PPs, reflecting the natural variability in hemodynamic parameters and vascular characteristics. Therefore, values determined for experimental cells (chemokine-desensitized or mock-treated cells of one color) were normalized by dividing by values obtained for coinjected internal standard population (labeled in a separate color) determined in the same recipient vessels. The ratio of chemokine-treated cell to internal standard cell values (e.g., rolling fractions), determined in one set of recipients, was then divided by the ratio of mock-treated control cell to internal standard cell values determined in littermate recipients, and multiplied by 100. Thus, the data presented represent the total flux, rolling fraction, or accumulation of chemokine-treated cells expressed as a percentage of those of mock-treated control cells labeled identically and analyzed in parallel. Therefore, 100% in the graph represents the behavior of the mock-treated control cells: for these cells, the total flux of cells entering HEVs in the blood per minute ranged from 16 to 60, mean 36 ± 14 SD in a representative experiment; the rolling fraction ranged from 27 to 100%, mean 69 ± 20% SD; and the number of cells accumulated in HEV segments ranged from 0 to 60 or more by 10 min. These values illustrate the natural variability associated with different vascular segments and observation periods that necessitated the use of internal standard cells for these studies. Rolling velocity ranged from 25 to 170 μm/s, mean 81 ± 46 SD. Mean results of five experimental animals for each treatment (± SD) are shown in the graph. Inhibition of accumulation by SLC treatment is significant compared with SDF-1α or control treatment by Student's t test (P < 0.01).

