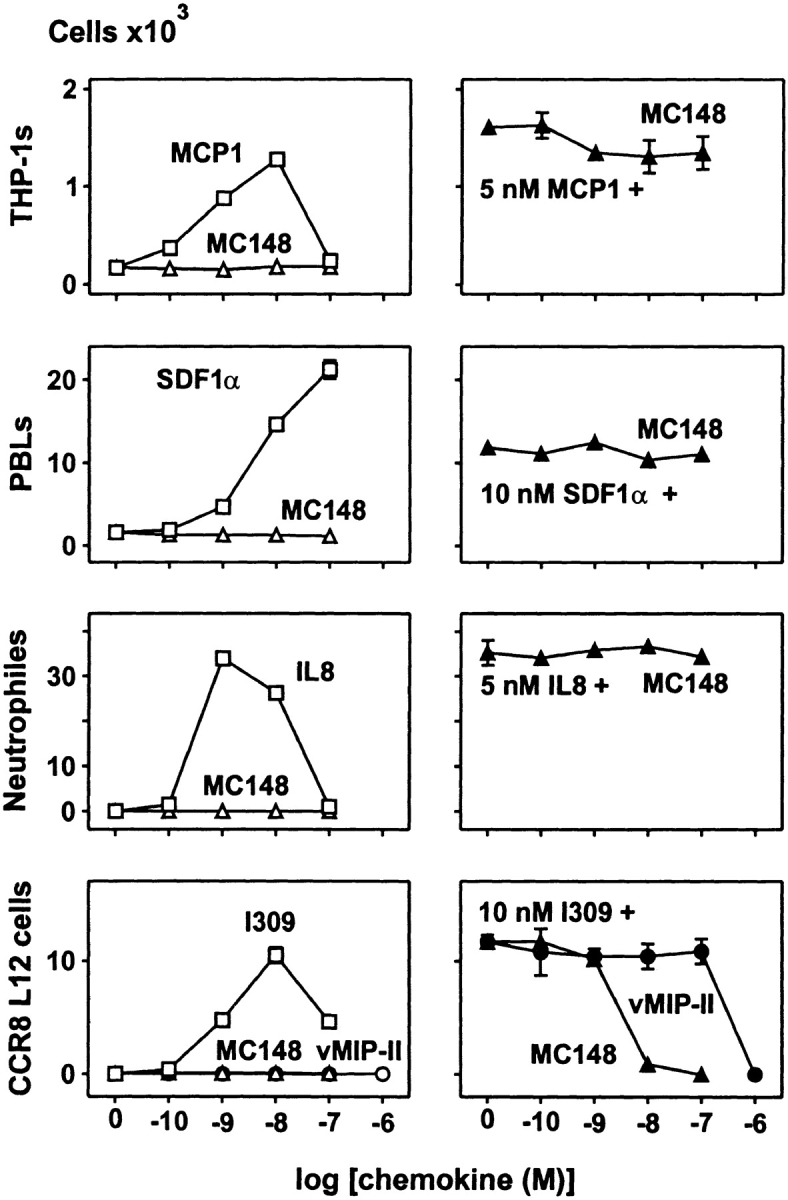
Figure 6.

Effect of MC148 on chemotactic activity on THP-1 cells (monocytic cell line), PBLs, neutrophils, and CCR8-transfected L12 cells. To the left, dose–response curves for MC148 (▵). Dose–response curves (□) for MCP-1, SDF-1α, IL-8, and I-309 are shown for comparison. The bottom panel includes a dose–response curve for vMIP-II (○). To the right, dose–response curves for inhibition by MC148 (▴) of chemotaxis induced by 5 nM MCP-1 on THP-1 cells, 10 nM SDF-1α on PBLs, 10 nM IL-8 on neutrophils, and 10 nM I-309 on CCR8-transfected L12 cells. The bottom panel includes a dose–response curve for inhibition by vMIP-II (•). One representative assay out of three is shown for THP-1 cells, out of four for PBLs, out of three for neutrophils, and out of five for CCR8-transfected L12 cells.
