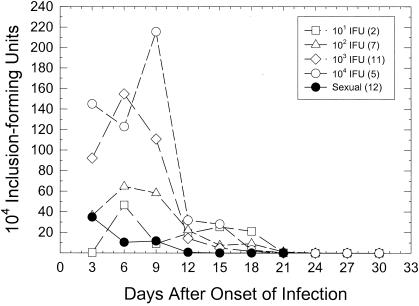
FIG. 1.
Kinetics of genital infection in female guinea pigs infected intravaginally with various doses of chlamydiae or by sexual transmission. In order to facilitate statistical comparison of infection curves for different animals and different groups, the curves were normalized by reporting the data in relation to when infection was first detected; i.e., the first day of positive isolation was arbitrarily called day 3 of infection. The numbers in parentheses are the numbers of animals which became infected in each group. The average numbers of IFU are plotted. Animals that did not become infected were not included.

