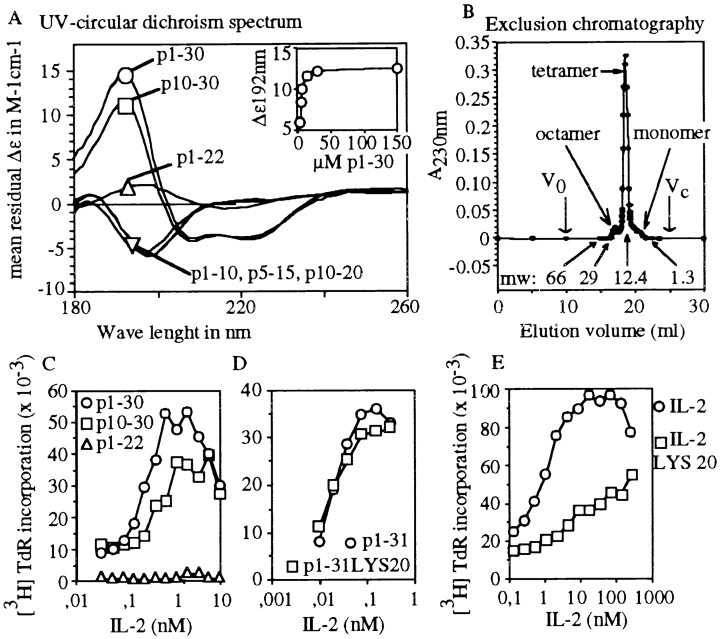
Figure 2.
Structure–function analysis of p1–30. (A) The CD spectra from 180 to 260 nm are shown for p1–10, p5–15, p10–20, p1–22, p10–30, and p1–30 at 150 μM. The p1–30 concentration dependence (3–150 μM) of the CD signal at 192 nm is shown in the insert. (B) Size exclusion chromatography. Peptide p1–30 was eluted as a single main peak of molecular mass 13 kD (according to column calibration). Arrows indicate molecular weight (mw) markers, void volume (V0) and total volume (Vc). Monomeric, tetrameric, and octameric forms are shown. (C) TS1β cell proliferation was tested at various concentrations of IL-2 (from 5 × 10⁻³ to 10 nM) with 60 μM of either p1–30, p1–22, or p10–30. The response to IL-2 or peptide alone was subtracted from that obtained with both IL-2 and peptide. (D) Role of Asp20 in p1–31 activity. TS1β cells were stimulated with various concentrations of IL-2 (from 5 × 10⁻³ to 10 nM) in the presence of 60 μM of peptide p1–31 or p1–31(Lys20). Results are presented as in C. (E) The biological activity of mutant IL-2(Lys20) is shown for comparison.

