Figure 6.

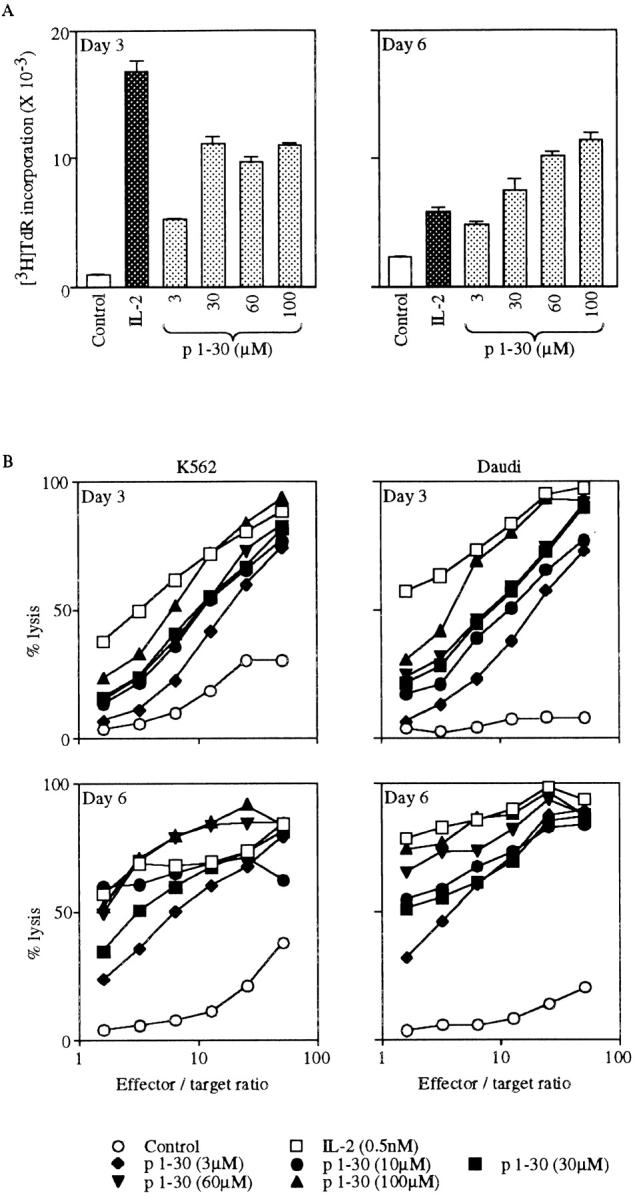
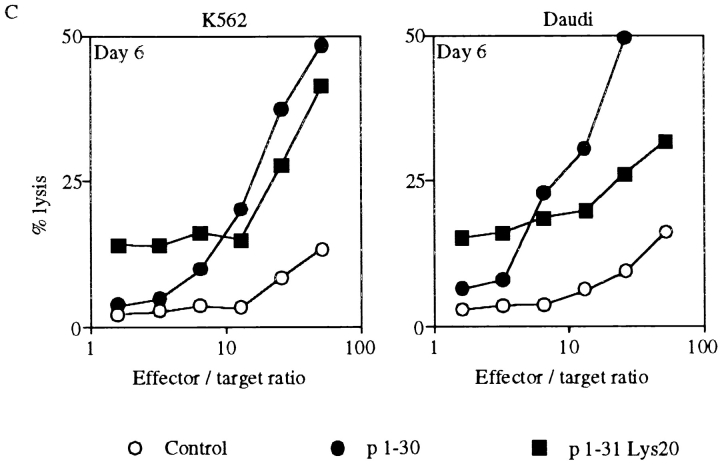
p1–30 activity on PBMCs. (A) Proliferation of PBMCs. PBMCs from healthy human donors were stimulated with IL-2 (0.5 nM) or p1–30 (3, 30, 60, or 100 μM) for 3 or 6 d followed by measurement of thymidine incorporation. The graph shows the negative control (white bars), IL-2–induced proliferation (black bars), and the dose-dependent p1–30-induced proliferation (gray bars). (B) Induction of LAK cells. PBMCs stimulated with IL-2 (0.5 nM) or p1–30 (3, 10, 30, 60, or 100 μM) for 3 or 6 d were tested for their ability to lyse K562 or Daudi target cells. Percent lysis at different effector/target ratios is shown. (C) LAK cell induction by p1–31(Lys20). The lysis of K562 or Daudi target cells by PBMCs stimulated with p1–30 or p1–31(Lys20) (30 μM) for 6 d was measured. Results obtained at different effector/target ratios are presented. Data of representative experiments are shown.

