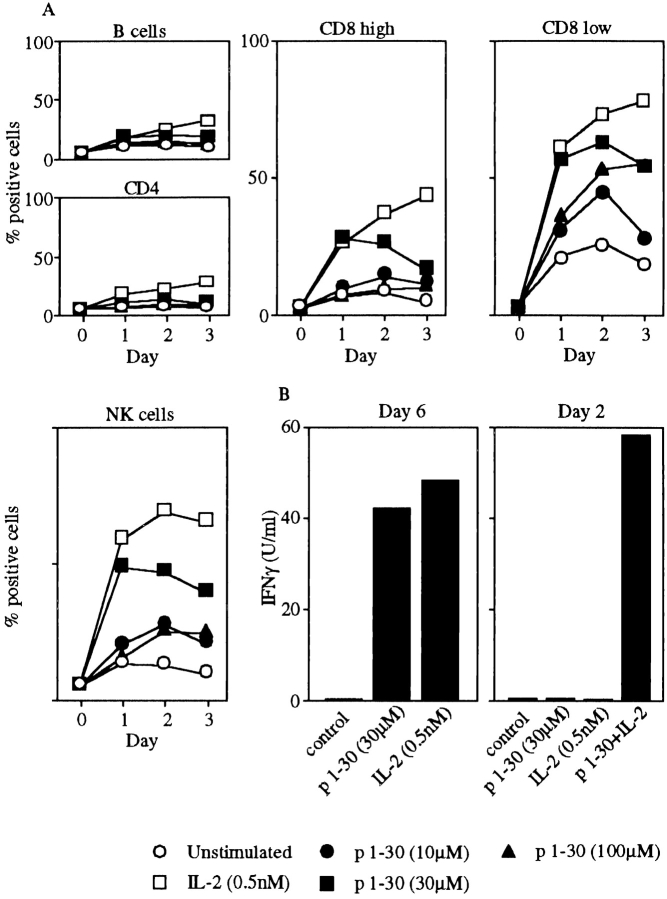
Figure 7.
Activation of NK and CD8 T cells by p1–30 and induction of IFN-γ. (A) PBMCs were stimulated with IL-2 (0.5 nM) or p1–30 (10, 30, or 100 μM) for 1, 2, or 3 d. Subpopulations labeled with anti-CD4 (Th lymphocytes), CD8 (CTLs), CD20 (B lymphocytes), or CD56 (NK cells) were assayed for CD69 expression. Graphs represent the percentage of CD69+ cells for each population with respect to stimulant (IL-2 or p1–30) and time (day) of stimulation. Data of a representative experiment are shown. (B) IFN-γ production was measured on supernatants from PBMCs stimulated with IL-2 (0.5 nM) or p1–30 (30 μM) at day 6. In a second panel, synergy between IL-2 (0.5 nM) and p1–30 (30 μM) is shown after 2 d of stimulation.

