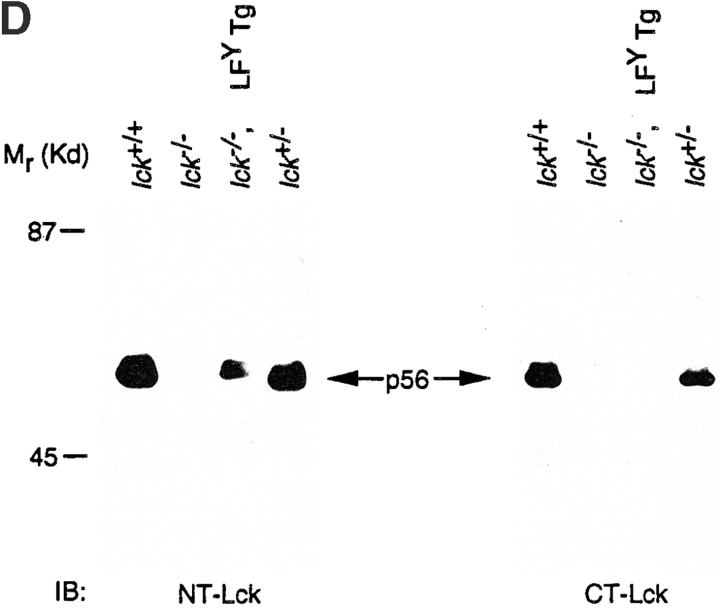
Figure 1.
(A) Schematic representation of parental and Lck/Fyn chimeric structures. wt, wild-type; U, unique. (B) Transforming efficiency of Src-PTKs in NIH-3T3 fibroblasts as measured in focus formation and soft agar growth assays. (C) Expression of transgene-encoded mRNAs in thymocytes from littermates representing indicated genotypes. Northern blot analysis using probes specific for the NH2-terminal regions of Lck or the COOH-terminal regions of FynT (left), or probes specific for the COOH-terminal regions of Lck or the NH2-terminal region of FynT (right). LFY, Lck-fyn chimera; FLF, Fyn-lckF chimera; Tg, transgene. (D) Immunoblot (IB) analysis of chimera expression using antibodies specific for NH2-terminal (NT) or COOH-terminal (CT) regions of p56lck.


