Figure 2.
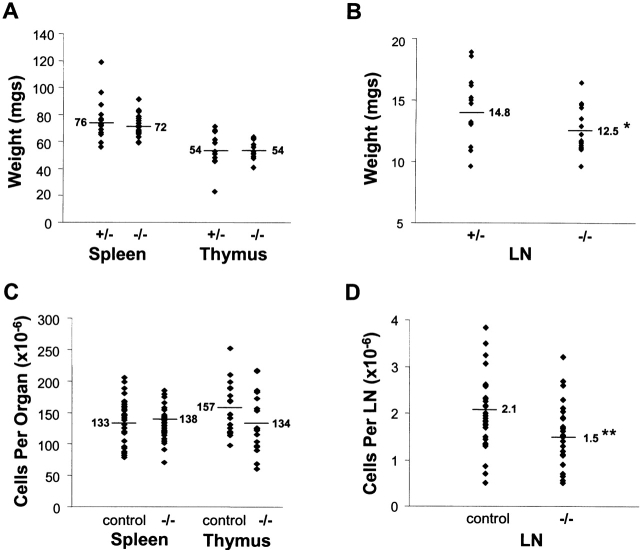
Lymphoid organ weights and cellularity. Average values are indicated by the horizontal lines. Significant differences in organ weights or cellularity between groups are indicated with asterisks. (A) Weights of individual spleens or thymi from 10–12.5-wk-old male IL-15+/− or IL-15−/− mice (n = 17–18/group). (B) Total weight of six peripheral LNs (two each of proper axillary, accessory axillary, and inguinal) from individual 10–12.5-wk-old male IL-15+/− or IL-15−/− mice (n = 17–18/group). *P < 0.05 (Student's t test). (C and D) Cellularity data were collected in multiple experiments, each of which used age- and sex-matched mice. The values shown are from both male and female mice between 9 and 20 wk of age. Control mice included IL-15+/− littermates (used in the majority of cases), IL-15+/+ littermates, and C57BL/6 mice. The average number of cells per LN was calculated from the combined cellularity of the six LNs described above. **P < 0.005 (mixed models analysis of variance).

