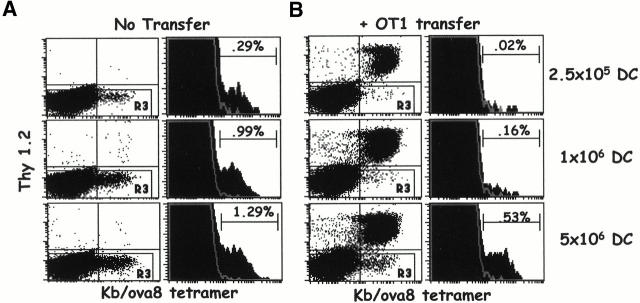
Figure 9.
OT1 T cells compete with endogenous T cells for access to DCs. B6.PL mice with and without the transfer of 2.5 × 10⁵ OT1 cells were challenged intravenously with B6 bone marrow DCs pulsed with 5 ng/ml of ova8 peptide. 5 d later, spleen cells were stained with tetramer as in the legend to Fig. 2. (A) Nontransferred B6.PL response to increasing numbers of DCs injected. The dot plots are gated on CD8+class II− events. The histograms were further gated on Thy1.2− (gate R3) events. (B) OT1-transferred B6.PL response to increasing numbers of DCs injected. Gating strategy as in A. (C) The average and standard deviation of endogenous T cell percentages from OT1-transferred and nontransferred mice, three mice per treatment.

