
Figure 3.
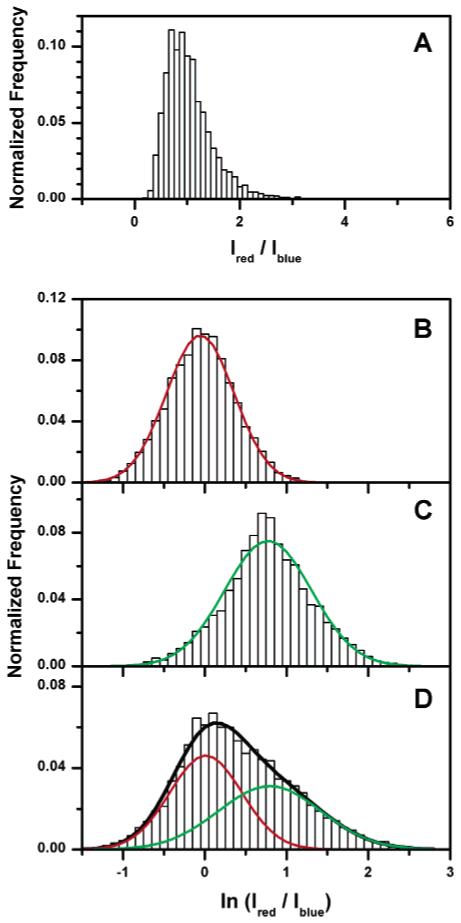
Fitting of histograms for dsDNA model samples labeled in 1:1 and 2:1 stoichiometries with Rhodamine green and Alexa-647. (A) Histogram of ratios for the 1:1 dsDNA model sample is asymmetric and does not fit to a single Gaussian distribution. (B) Histogram of the logarithms of ratios for the same 1:1 dsDNA model sample data (11429 coincident events) is well fitted by a single Gaussian distribution (red line) with one fitted parameter: . The experimentally derived fluorophore brightnesses were 27.8 counts ms-1 and 26.3 counts ms-1 for Rhodamine green and Alexa-647, respectively. (C) Histogram of logarithms of ratios for the 2:1 dsDNA model sample data (10746 coincident events) is well fitted by a single Gaussian distribution (green line) with one fitted parameter: . The experimentally derived fluorophore brightnesses were 24.3 counts ms-1 and 26.3 counts ms-1 for Rhodamine green and Alexa-647, respectively. (D) Distribution over 12158 coincident events observed for an equimolar mixture of the 1:1 and 2:1 dsDNA samples and the fitted distribution using two Gaussians. The black, red, and green lines are the fitted distributions for the mixture, 1:1 component and 2:1 component, respectively. The two fitted parameters were the brightness of the Alexa-647 fluorophore (23.5 counts ms-1) and the relative population of monomer (49% ± 8%) to dimer (51% ± 8%). The experimentally derived brightness of the Rhodamine green fluorophore was 23.3 counts ms-1, and was fixed at 1.52 and 2.16 for the monomer and the dimer distributions, respectively.