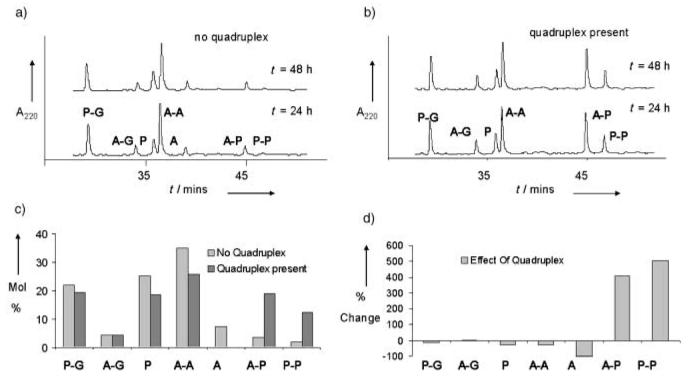
Figure 1.
a) HPLC traces showing the component composition for exchange experiments in glutathione-containing buffer with use of A and P (200 μm each) in the absence of quadruplex DNA, at times denoted. b) HPLC traces showing the component composition for exchange experiments in glutathione-containing buffer with use of A and P (200 μm each) in the presence of quadruplex DNA, at times denoted. c) Histogram showing the change in equilibrium mixture composition on introduction of quadruplex DNA. Values were measured by HPLC-peak area, taking into account differences in extinction coefficients. d) Histogram showing the percentage changes in each species of the equilibrium mixture upon introduction of quadruplex DNA.

