
Figure 2.
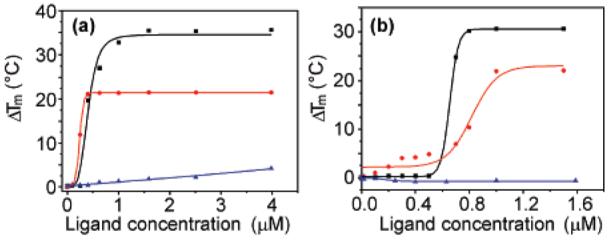
FRET stabilization curves for macrocycle 1 (a) and telomestatin (b) upon binding to h-telo (black square), c-kit (red circle), and double-stranded DNA (blue triangle).
Official websites use .gov
A
.gov website belongs to an official
government organization in the United States.
Secure .gov websites use HTTPS
A lock (
) or https:// means you've safely
connected to the .gov website. Share sensitive
information only on official, secure websites.
FRET stabilization curves for macrocycle 1 (a) and telomestatin (b) upon binding to h-telo (black square), c-kit (red circle), and double-stranded DNA (blue triangle).