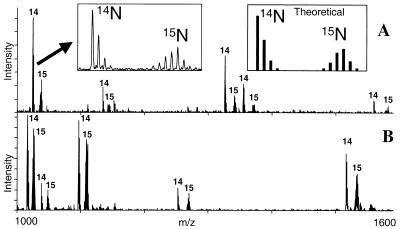
Figure 3.
Examples of MALDI-MS spectra of tryptic peptides obtained from proteins derived from two pools of S. cerevisiae that differ only in their ability to express the G1 cyclin CLN2. (A) Elongation factor 1α; (B) Triosephosphate isomerase. The numbers “14” and “15” denote peaks originating from unlabeled (cln2−) and 15N-labeled (CLN2+) tryptic peptides. The ratios of the intensities of the pairs of unlabeled to labeled peaks were used to quantitate the relative levels of the proteins in the two cell pools. (Left Inset) Detail shows a pair of peaks from a single tryptic peptide. The lower mass cluster of peaks corresponds to isotopically resolved components of the unlabeled peptide whereas the upper mass cluster corresponds to the isotopic components of the 15N labeled peptide. Tests of the goodness of fit of the theoretical isotope distribution (Right Inset) to the experimental distribution (Left Inset) revealed that the level of incorporated 15N label was 93 ± 1%. The peak intensity for the unlabeled peptide was determined by integrating the intensities of each component in the lower isotopic cluster whereas that for the labeled peptide was determined by integrating the intensity of each component in the upper isotopic cluster.

