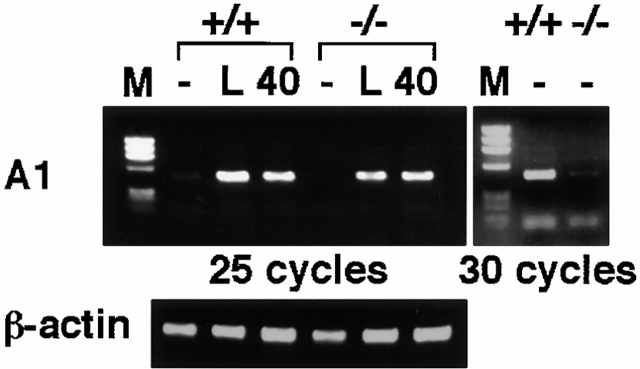
Figure 5.
Decrease of basal A1 gene expression in IKKα2/− B cells. A1 expression was analyzed in IKKα1/+ or IKKα2/− B cells with or without LPS (L) or anti-CD40 40 stimulation through reverse transcription PCR analysis. Basal A1 gene expression was determined by amplification with 30 cycles. As controls, data for β-actin expression are shown. M, Φ×174/HaeIII digest marker.

