
Figure 2.
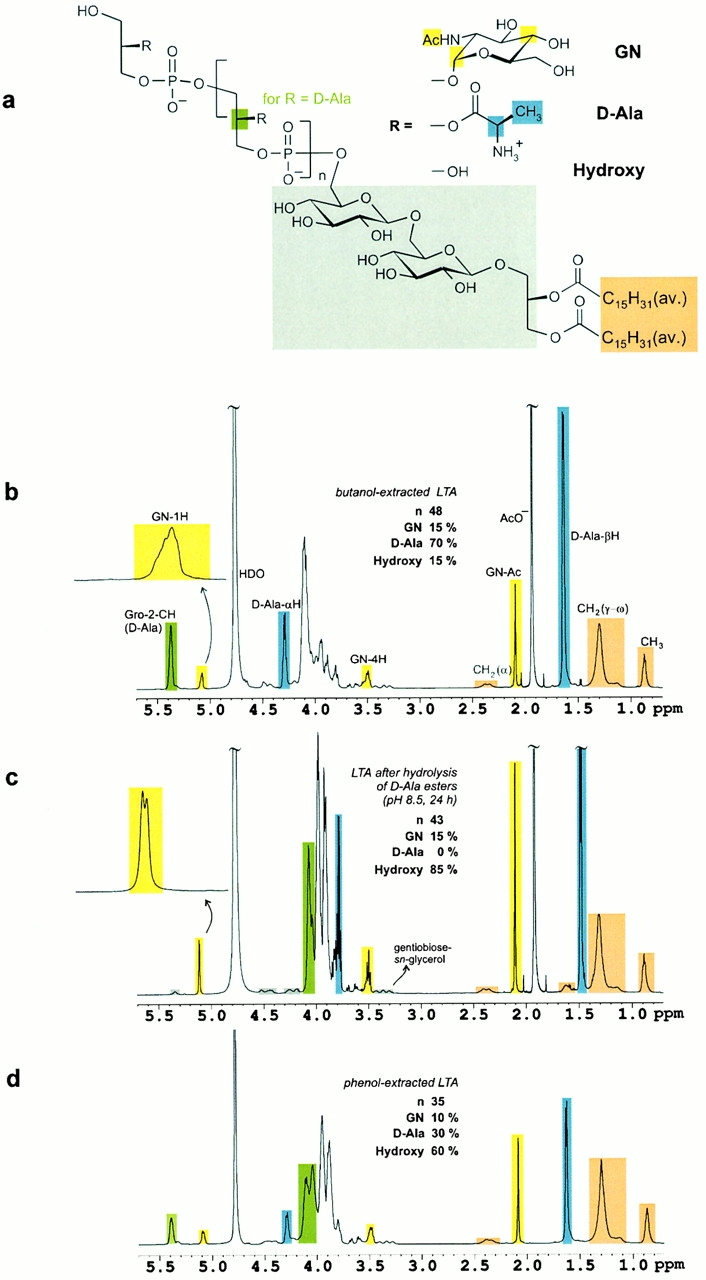
(A) The structure of S. aureus LTA as determined from NMR spectroscopic analysis. Color coding identifies the methine group of the sn-glycerol repeating unit (green), three resonance signals of d-N-acetylglucosamine (GN, yellow), d-alanine (d-Ala, blue), gentiobiose-sn-glycerol (gray), and fatty acids (orange). (B) 1H NMR spectrum (600 MHz, 300 K) of LTA obtained after butanol extraction. The resonance signal intensities allow for the quantification of the substituents and the average glycerophosphate chain length (45 < n < 50). Microheterogeneity leads to signal broadening as visible in the expansion of the anomeric proton of d-N-acetylglucosamine. (C) Hydrolysis of the d-alanine esters was performed at pH 8.5 in the NMR tube overnight. No cleavage of the fatty acids was observed under these conditions. The anomeric proton of N-acetylglucosamine resolved to a doublet with a vicinal coupling constant of 3.6 Hz as expected for an α-glycosidic bond. The gentiobiose resonances are highlighted in gray. (D) S. aureus LTA obtained after standard phenol extraction was characterized by a reduced chain length and significant hydrolysis of d-alanine esters. The alkyl chains of the fatty acids served as reference intensities for comparison of the three 1H NMR spectra, B–D.