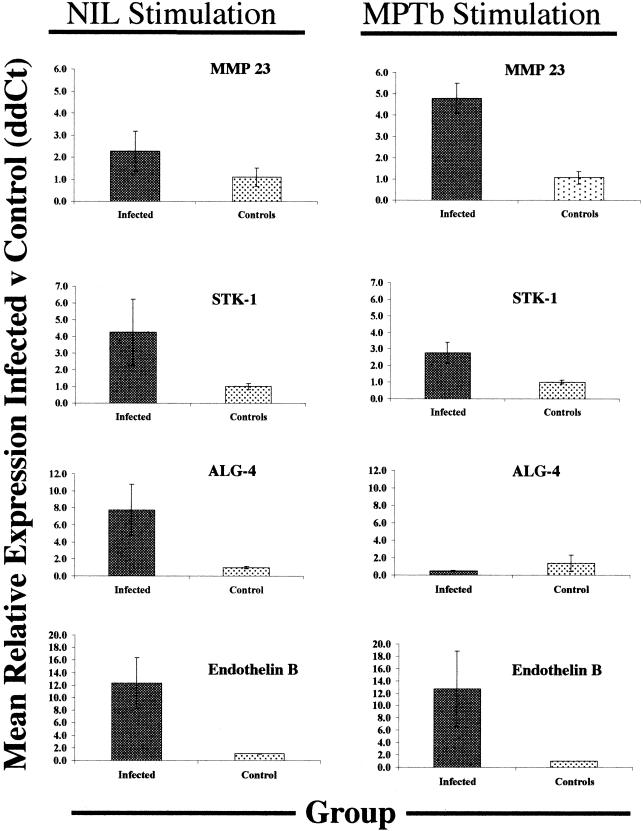
FIG. 5.
Q-RT-PCR validation of gene expression changes observed following microarray analysis of PBMCs from control and infected cows. Genes to be validated were selected from a list of the genes whose expression was most significantly different following nil stimulation of PBMCs from infected and control cows. Q-RT-PCR was performed as described in Materials and Methods, and data were analyzed by using the 2−ΔΔCt method with β-actin as the control gene. Mean values for control cow PBMCs with nil stimulation or M. avium subsp. paratuberculosis (MPTb) stimulation were used as calibrators for calculation of all 2−ΔΔCt values, so that the values for control cows always bracketed 1.0. For Q-RT-PCR analysis, samples were arranged in 96-well PCR plates so that comparisons could be made between PBMCs from infected cows and PBMCs from control cows, each stimulated with M. avium subsp. paratuberculosis or PBS (nil stimulation), on the same plate. The data are means ± standard errors of the means for 2−ΔΔCt values for three or four infected cows and three or four control cows for each gene.

