Figure 1.
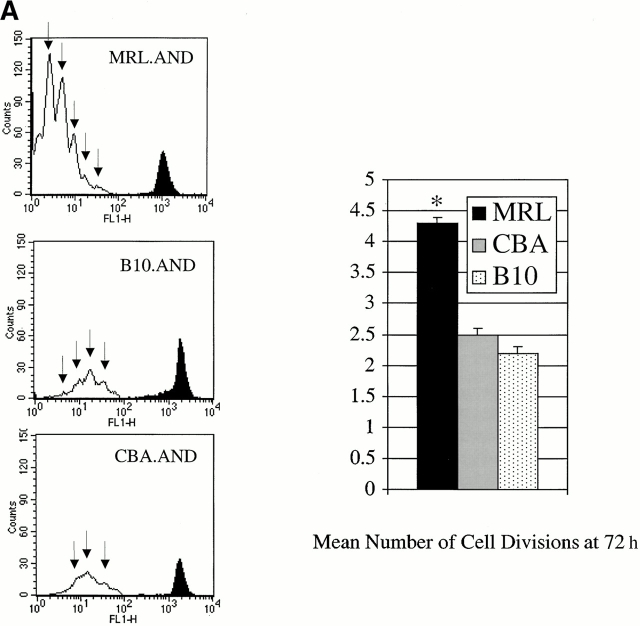
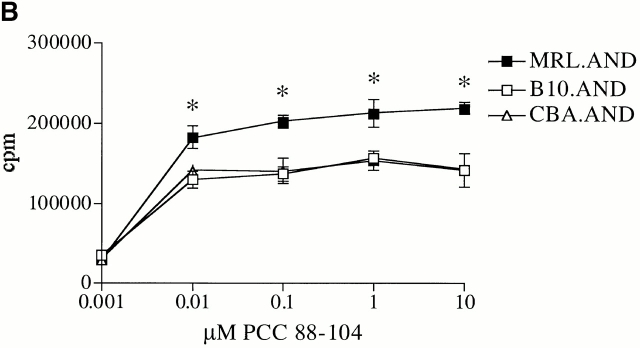
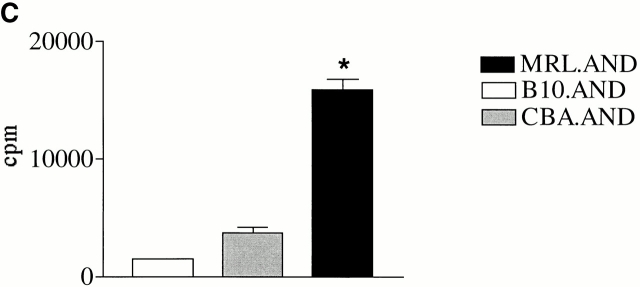
CD4+ AND transgenic T cells from MRL mice proliferate more after agonist peptide and mitogenic stimulation than CD4+ AND transgenic T cells from nonautoimmune strains. (A) Naive CD4+ transgenic T cells were labeled with CFSE and stimulated with 0.05 μM PCC 88–104 agonist peptide using CH27 cells as APCs. The number of cell divisions at 72 h was determined by CFSE labeling. CH27 and dead T cells were excluded from the analysis on the basis of forward/side scatter. The mean number of cell divisions at 72 h is indicated in the bar graph at the right. *P < 0.005 for comparison of MRL.AND to B10.AND or CBA.AND cells. Arrows indicate evidence of cell division. (B) Naive AND transgenic T cells were stimulated in vitro by I-Ek bearing B7.1+/B7.2+ CH27 cells pulsed with varying concentrations of PCC 88–104. Proliferation was measured at 72 h by [3H]thymidine incorporation. Results are means of quadruplicate measurements. Error bars represent SEM. *P < 0.05 for comparison of MRL.AND to B10.AND or CBA.AND cells. (C) Naive AND transgenic T cells were stimulated in vitro with 10 ng/ml of PMA and 500 ng/ml of ionomycin. Proliferation was measured at 72 h by [3H]thymidine incorporation. Results are means of quadruplicate measurements. *P < 0.05 for comparison of MRL.AND to B10.AND or CBA.AND cells.


