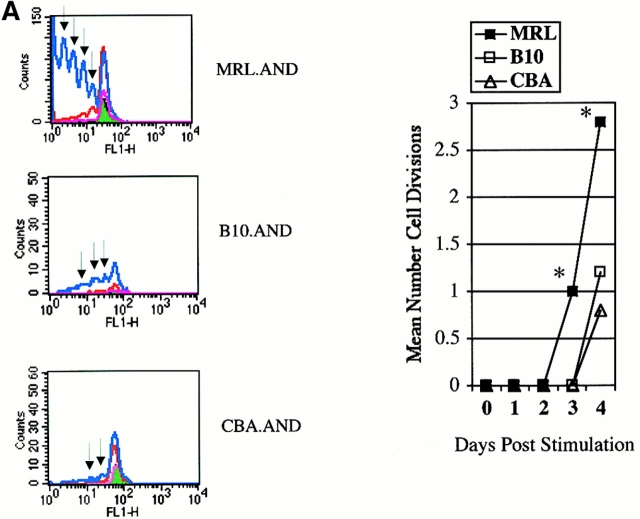
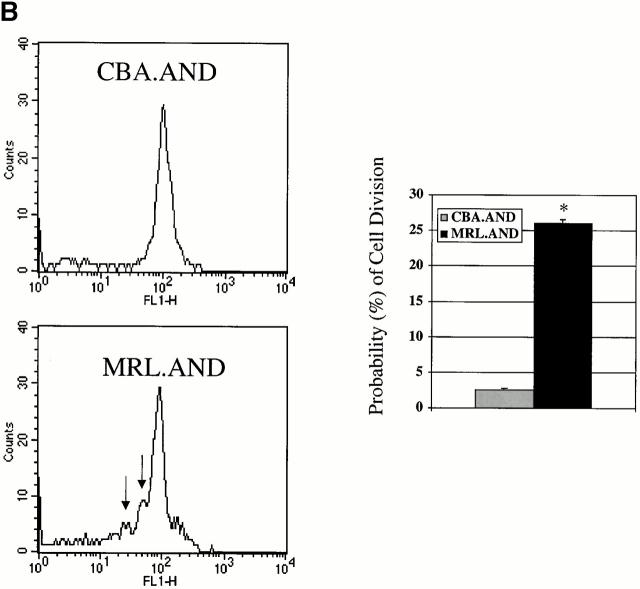
Figure 3.
(A) AND transgenic T cells labeled with CFSE and stimulated in vitro with CH27 cells alone (pink line) or pulsed with either 5 μM (red line) or 25 μM (blue line) K99Q. Fluorescence of T cells cultured without APCs is indicated in green with analysis performed at 96 h. Arrows indicate evidence of cell division. The mean number of cell divisions at 96 h is indicated in the bar graph at the right. *P < 0.005 for comparison of MRL.AND to B10.AND or CBA.AND cells. The change in scale used in MRL plot is indicative of the increased number of T cells. CH27 and dead T cells were excluded from the analysis on the basis of forward/side scatter. (B) AND transgenic T cells were labeled with CFSE and stimulated with 25 μM antagonist K99R. Arrows indicate cell division at 48 h. The probability of cell division is shown in the bar graph at right. Error bar represents SEM. *P < 0.0001 for comparison of MRL.AND to CBA.AND T cells.


