
Figure 10.
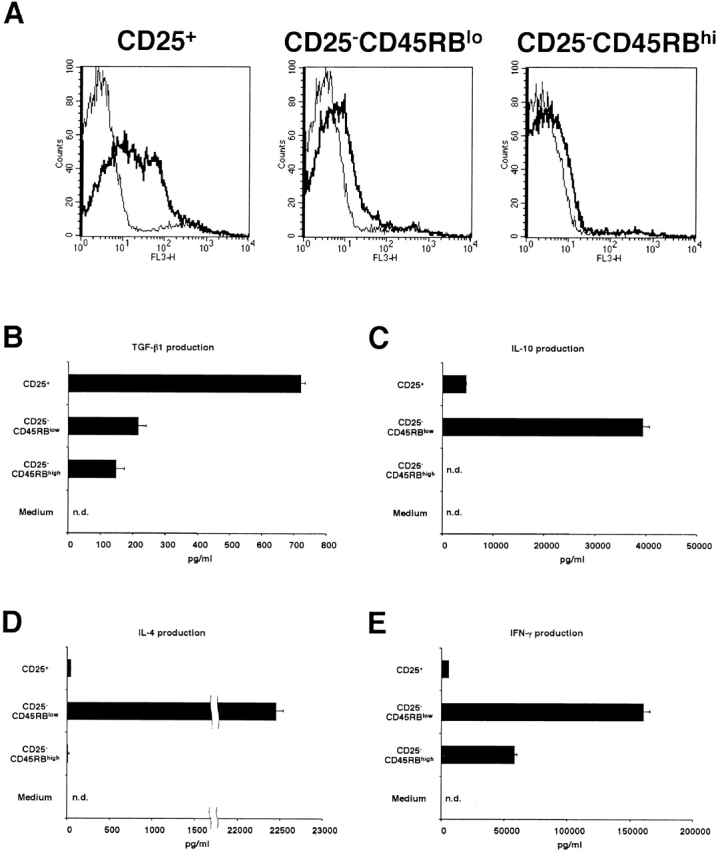
Comparison of cytokine expression among CD25+, CD25−CD45RBlow and CD25−CD45RBhigh populations of CD4+ T cells. (A) Purified CD4+CD25+, CD4+CD25− CD45RBlow and CD4+CD25−CD45RBhigh T cells were stimulated with plate-bound anti-CD3 (10 μg/ml) and anti–CTLA-4 (10 μg/ml), soluble anti-CD28 (2 μg/ml), and IL-2 (20 U/ml). 24 h later, cells were incubated with either biotin-conjugated chicken anti–TGF-β1 or biotin-conjugated normal chicken Ig G, washed, and stained with Cy-Chrome™–conjugated streptavidin. Expression of cell surface–bound TGF-β1 is shown. Thick lines: anti–TGF-β; thin lines: normal chicken IgG. (B–E) 105 CD4+ CD25+, CD4+ CD25−CD45RBlow and CD4+ CD25−CD45RBhigh T cells were stimulated with plate-bound anti-CD3 (10 μg/ml) and anti–CTLA-4 (10 μg/ml), soluble anti-CD28 (2 μg/ml) and IL-2 (20 U/ml) in 100 μl culture for 72 h. The amount of TGF-β1 (B), IL-10 (C), IL-4 (D), and IFN-γ (E) in culture supernatant was measured by ELISA. In B, 1% Nutridoma/RPMI was used for culture media. The results shown represent the mean ± SEM of triplicate wells with each well measured in duplicate. n.d., not detected.