
Figure 2.
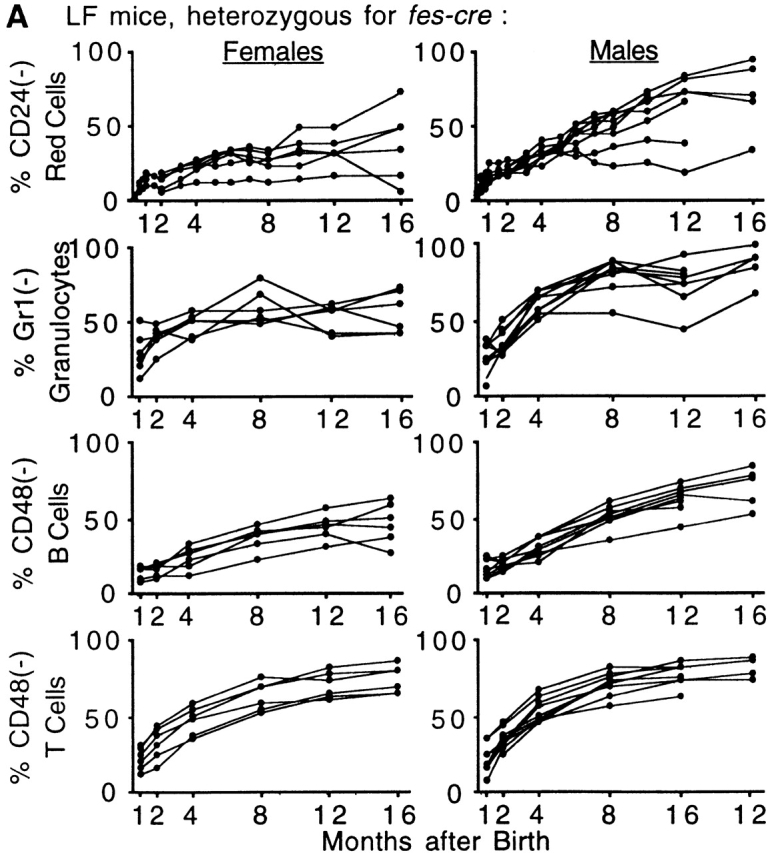


Proportions of PIGA− cells in peripheral blood from LF and LFF mice. (A) 16 mo follow-up of the proportion of PIGA− blood cells in LF mice (females n = 6, males n = 9). (B) Comparison of the relative number of PIGA− cells in different blood cell lineages in LF mice. Each data point represents the average value from six female and nine male mice. (C) Proportion of PIGA− blood cells in three male LFF mice. The gray-shaded area represents the proportions of PIGA− cells between the 10th and 90th percentile in male LF animals for comparison. (D) Flow cytometric analysis of peripheral blood cells from an 8-mo-old male LFF mouse with 100% PIGA− red cells, 99% PIGA− granulocytes, 93% PIGA− B cells, and 94% PIGA− T cells. Most of the few remaining PIGA+ B and T cells were CD44high and CD62Llow (data not shown), suggesting that they are mainly long lived memory cells. Monoclonal antibodies against CD24, GR-1, and CD48 were used as markers for GPI-linked proteins. Antibodies identifying the blood cell lineage were CD11b for granulocytes, B220 for B cells, and TcR for T cells. Red blood cells were identified by their light scatter characteristics. The top left quadrant shows the proportion of PIGA− cells for each blood cell lineage.