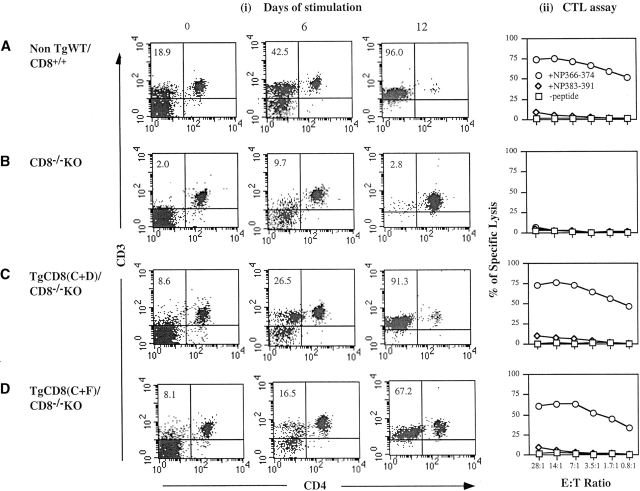
Figure 4.
Analysis of the anti–influenza A T cell response of TgCD8(C+F)/CD8−/− KO mice. 3 wk after infection, single cell suspensions of (A) non-Tg WT/CD8++, (B) CD8−/−KO, (C) TgCD8(C+D)/CD8−/−KO, and (D) TgCD8(C+F)/CD8−/−KO H-2b mice were stimulated for two 6-d periods with flu peptide NP366–374 and then tested in a 51Cr-release assay. Targets were EL4 (H-2b) cells pulsed with NP366–374 (+NP366–374), an irrelevant non–H-2b-binding flu peptide NP383–391 (+NP383–391), or no peptide (−peptide) (right panels, (ii) CTL assay]. The E/T ratio and percentage of specific lysis are indicated. On days 0, 6 and 12, cell samples of all groups (A–D) were stained for CD3 and CD4. The profiles in (i) show the results. The numbers in specific quadrants represent the percentage of cells with the indicated phenotype.

