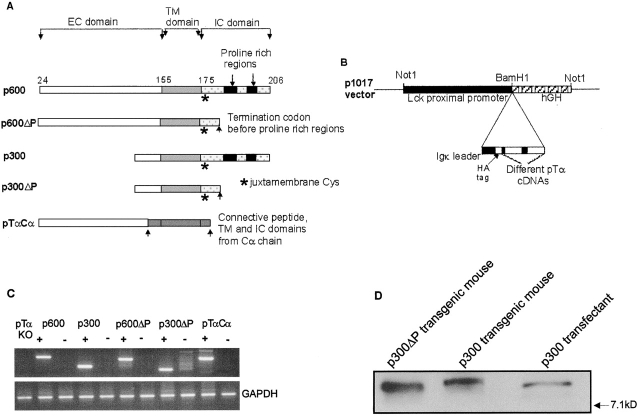
Figure 1.
Schematic representation of different pTα transgenes and their expression. (A) Schematic representation of the five different pTα cDNAs constructed as described in Materials and Methods. (B) Each of the pTα cDNAs was cloned (together with a HA tag and Igκ leader sequence) into the BamH1 site of the p1017 vector. The purified Not1 fragment of p1017 recombinants was microinjected into the pronuclei of fertilized eggs. (C) Reverse transcription (RT)-PCR detection of pTα mRNA expression from thymocytes of the different pTα transgenics. Transgenics positive by genotyping (+) gave a positive mRNA expression when compared with those that were negative by genotyping (−). GAPDH was positive in all samples. (D) The expression of p300 and p300ΔP protein in thymocytes from transgenic mice compared with protein expression in a p300 transfected cell line. 7.1 kD denotes the migration of a protein size marker on the same gel.

