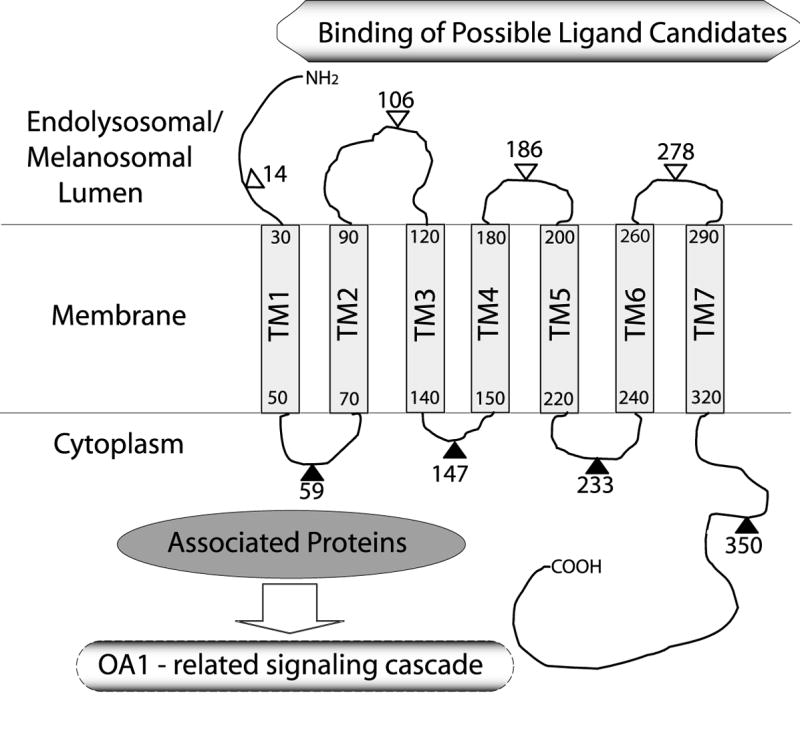
Fig. 6. A model for the membrane topology of OA1 as determined by HA insertion.

Transmembrane regions are represented by hatched boxes. Filled triangles with amino acid number indicate the sites of inserted HA tags which were accessible to HA antibody after partial permeabilization, whereas open triangles mark those which were not accessible under the same condition. Amino acid numbers at the N- and C- terminus of each hatched box indicate the approximate TM regions estimated by Kyte and Doolittle’s hydrophobicity scale (21) shown in Fig. 1 A.
