Figure 2.
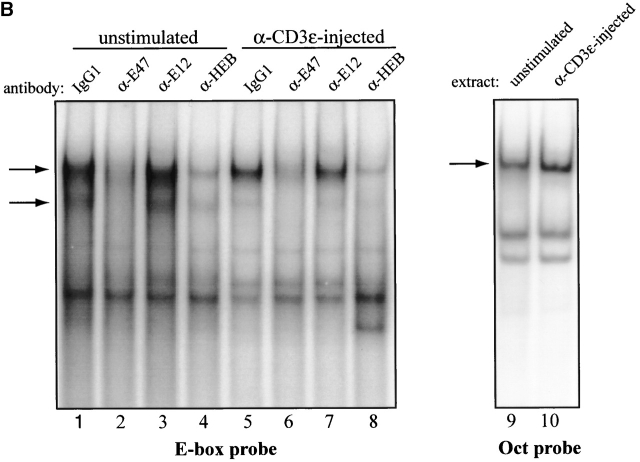
Regulation of E-box–binding activity during thymocyte β selection. RAG-1−/− thymocytes were harvested at indicated times after intraperitoneal anti-CD3ε injection. (A) Flow cytometric analysis of RAG-1−/− thymocytes at various time points after injection of anti-CD3ε. The number of cells per thymus for each time point is indicated above each column of dot plots. Top row of dot plots shows CD4 versus CD8 expression profile of live-gated cells. Bottom row shows CD44 versus CD25 profile of live-gated DN cells. (B) EMSA of thymic extracts binding to a μE5 oligonucleotide probe. (Left) Thymocyte whole cell extracts (15 μg) prepared from unstimulated RAG-2−/− mice (lanes 1–4) and RAG-2−/− mice injected with anti-CD3ε 24 h before extract preparation (lanes 5–8), were preincubated with 0.5 μg of irrelevant mouse IgG1 antibody (lanes 1 and 5), anti-E47 (lanes 2 and 6), anti-E12 (lanes 3 and 7), or anti-HEB (lanes 4 and 8), before performing EMSA using a μE5 probe. Arrows indicate specific complexes. (Right) The same extracts used in the left panel were tested for binding to an Oct probe at 10 μg per lane.


