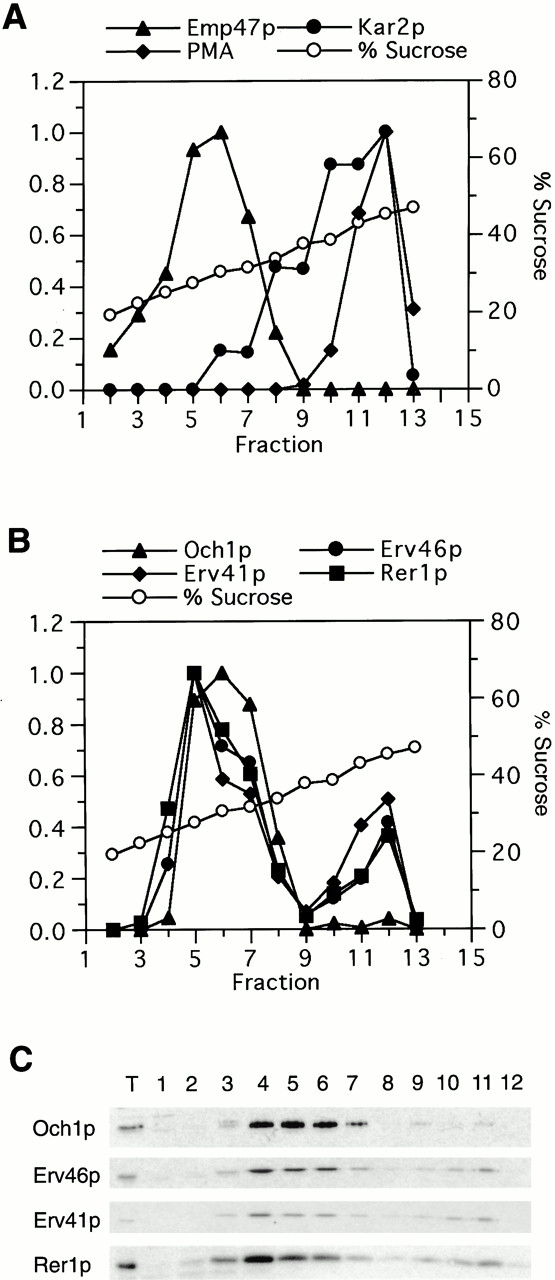
Figure 5.

Sucrose gradient fractionation of Erv41p, Erv46p, Och1p, and Rer1p. An FY834 whole cell lysate was separated on an 18–60% sucrose density gradient, and fractions were collected, starting with fraction 1 at the top. (A) Relative levels of Emp47p (Golgi marker), Kar2p (ER marker), and plasma membrane marker (PMA) in each fraction were quantified by densitometry of immunoblots. (B) Relative levels of Och1p, Erv46p, Erv41p, and Rer1p as determined by densitometry of the immunoblots shown in C.
