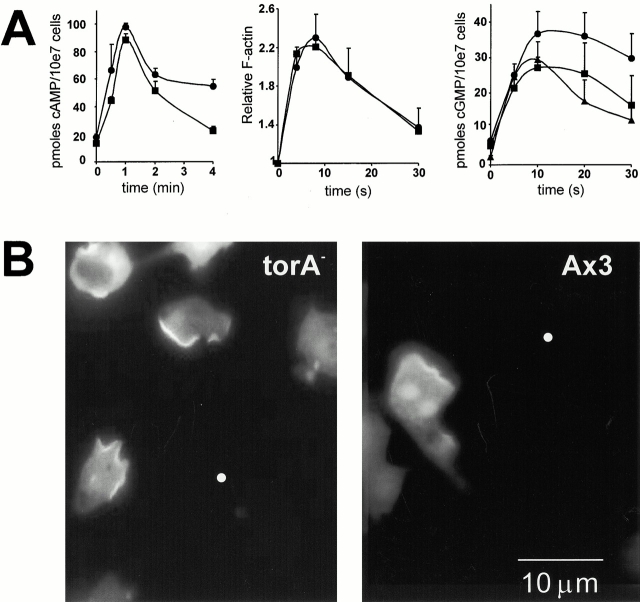
Figure 4.
Biochemical responses towards cAMP in torA −. Cells were developed for 5 h in a shaken suspension with the addition of 100-nM pulses of cAMP every 6 min or on DB-agar plates (in the case of cGMP accumulation) (A) Signal transduction responses: 5 × 10⁻⁵ M 2′deoxy-cAMP (cAMP accumulation), 10−7 M cAMP (F-actin), 10-6 M cAMP (cGMP accumulation). •, torA −; ▪, Ax3; ▴, mek1 −. (B) Translocation of Crac PH-domains to the leading edge of torA − and wild-type cells in a cAMP gradient. The white dot indicates the position of the micropipette filled with 10−6 M cAMP. Bar, 10 μm.

