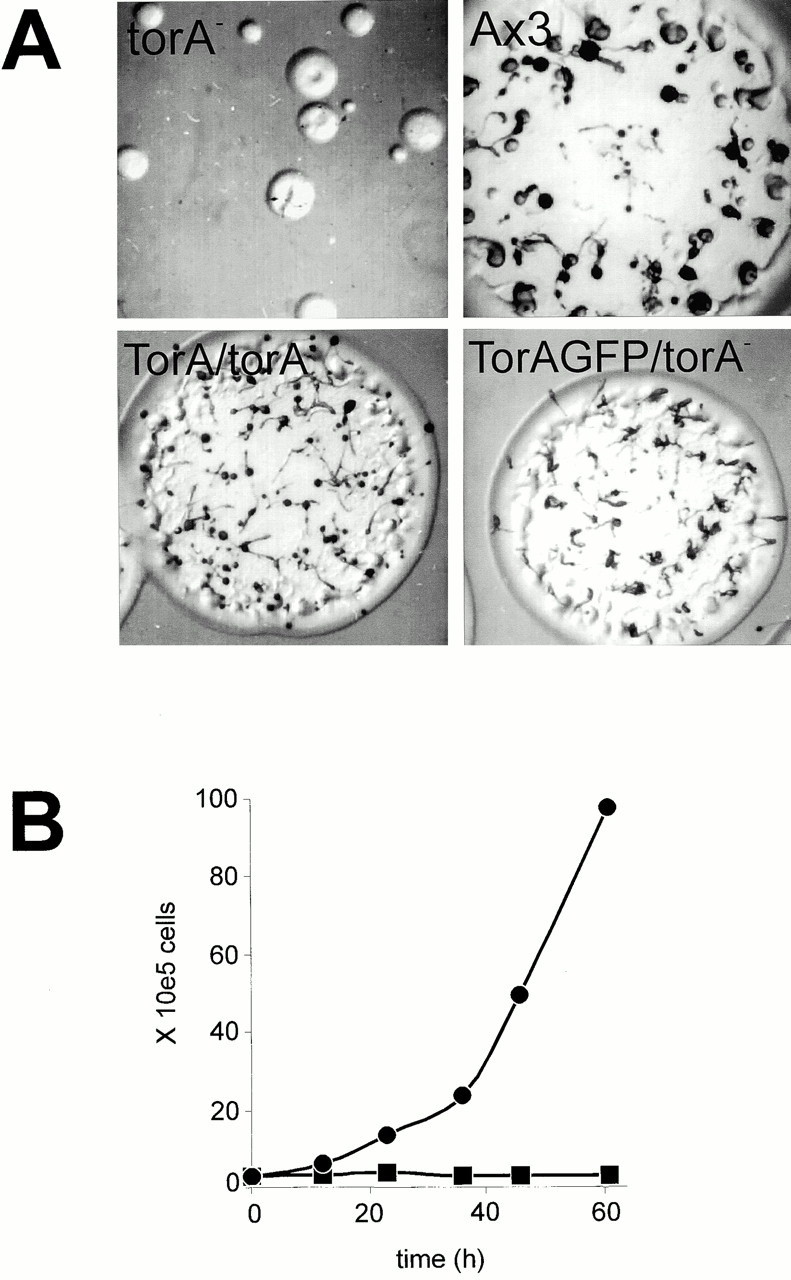
Figure 5.

Effects of constitutive expression of TorA and TorA–GFP on plaque size of torA − and growth in suspension. (A) Plaques of torA − and cells expressing TorA or TorA–GFP, grown for 6 d on K. aerogenes lawns. (B) Growth curves of Ax3 cells and Ax3 cells expressing TorA. Cells were grown to confluency in petri dishes and then shaken in flasks at 3 × 10⁵ cells/ml and counted at the indicated time points. •, Ax3; ▪, Ax3 cells overexpressing TorA.
