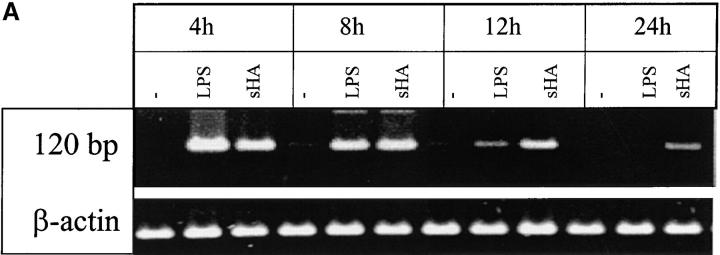
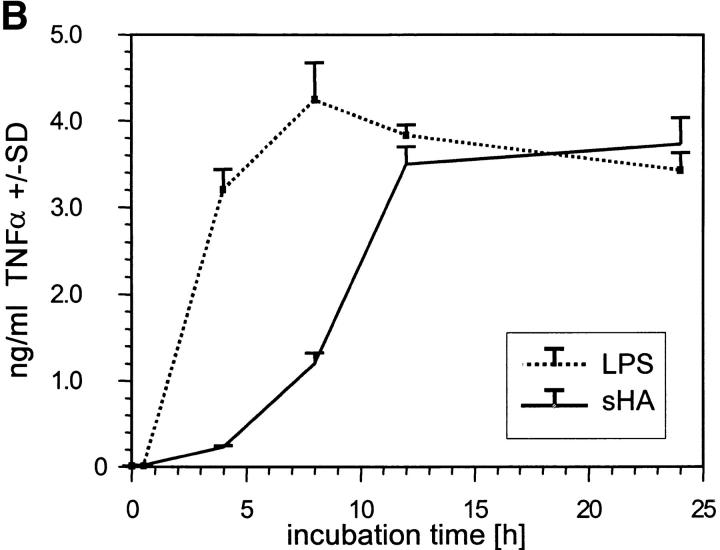
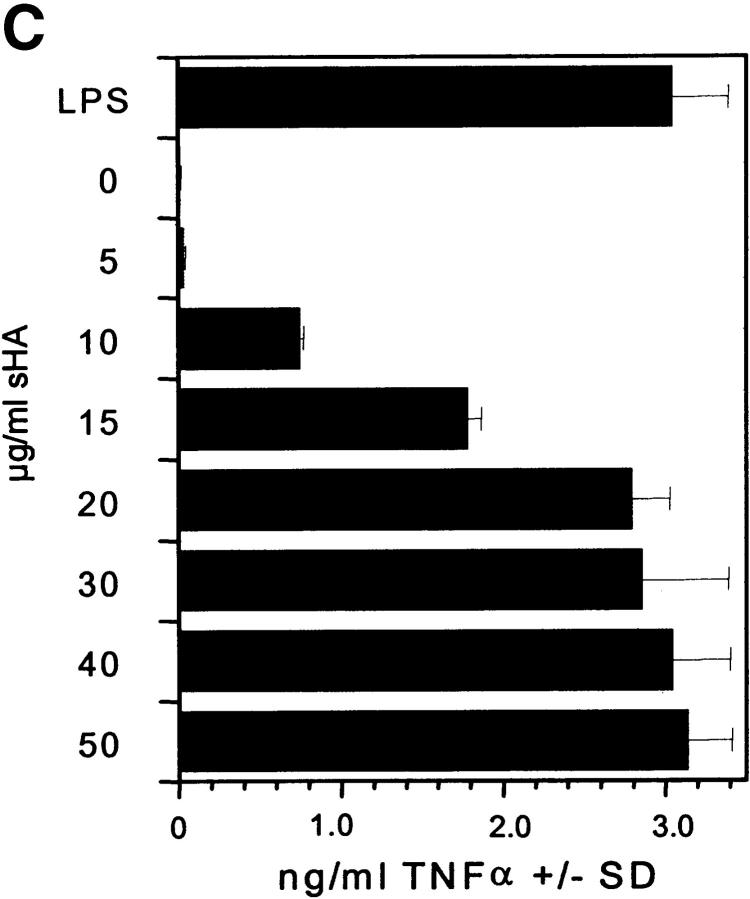
Figure 2.
Analysis of TNF-α production by DCs in response to sHA stimulation. (A and B) Human monocyte–derived day 4 DCs were treated with 25 μg/ml sHA or 100 ng/ml LPS for the indicated times. After stimulation, (A) cells were harvested and RNA was prepared for TNF-α–specific RT-PCR, and (B) cell-free supernatants were collected and assayed by TNF-α ELISA. The dotted line shows the response to LPS, the solid line the response to sHA. Data represent the mean TNF-α release of triplicate values; pg/mg total protein ± SD. (C) DCs were incubated for 24 h with the indicated concentrations of sHA or 100 ng/ml LPS and cell-free supernatants were collected and assayed by TNF-α ELISA as detailed above.


