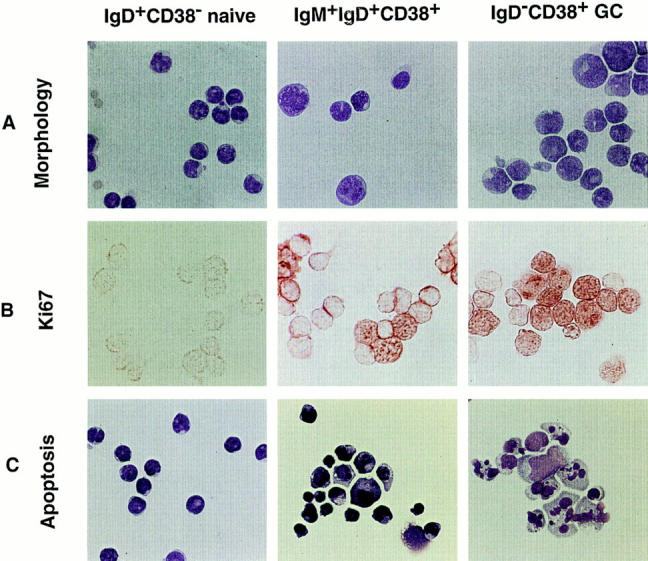
Figure 2.

Cytological characterization of slgM+IgD+CD38− naive, slgD−CD38+ GC, and slgM+IgD+CD38+ B cells. (A) Giemsa staining of freshly isolated three B cell subsets (×1,000). (B) Expression of proliferation associated nuclear antigen Ki67 on freshly isolated B cell subsets (×1,000). (C) Giemsa staining of three B cell subsets after a 16 h culture, showing apoptotic figures in slgM+IgD+CD38+ GC founder cells and in slgD−CD38+ GC B cells. The quantitation of apoptotic cells is shown in Table 2.
